
VMware Monitoring
See how to monitor virtual machines, datastores, hardware status, and the performance counters of host and guest VMs.
NetCrunch supports ESXi version 4 or newer. It can connect directly to the ESXi servers or through vSphere vCenter.
NetCrunch comes with pre-configured Automatic Monitoring Packs to monitor ESX as soon as OS monitoring is set to ESX.
how-it-fits
How the Pieces Fit Together
Three things are involved, and they are not three of the same kind of thing. This is the part worth getting straight before configuring anything.
- The ESXi host
- A node. You add it to the atlas like any other machine and set its OS monitoring to ESXi. This is what NetCrunch monitors.
- A virtual machine
- Visible without being a node. Every guest on a monitored host appears in that host's system views, with no configuration at all. A guest only becomes a node if you choose to add it — separately monitored, with its own services and its own status.
- vCenter
- A sensor, not a node type. You add the vSphere vCenter Server sensor to the node representing the machine running vCenter. It does not replace your ESXi host nodes; it changes how NetCrunch reaches the ones it already has.
That last point is the one that surprises people. Adding vCenter does not give you a new set of objects to monitor. It switches the ESXi hosts you already monitor into vCenter mode, and unlocks the things only vCenter can report.
setting-up
Setting It Up
- Add the ESXi hosts as nodes and set OS monitoring to ESXi. The automatic monitoring packs apply themselves, and monitoring starts.
- If you run vCenter, add the vSphere vCenter Server sensor to the node representing the vCenter machine. Applicable hosts switch to vCenter mode on their own.
- Set credentials on the ESXi hosts as well, even when using vCenter. This is what makes the fallback in the next section possible.
- Decide whether guests become nodes — see Adding ESXi guests below.
Monitoring Modes
vCenter
Requires the vSphere vCenter Server sensor on the node hosting the vCenter server. The sensor automatically switches applicable ESXi hosts to be monitored through the vCenter connection.
Features such as active alarms and configuration issues are available in vCenter mode only.
The sensor connects over HTTPS and can be set to require a valid SSL certificate. Its connection timeout defaults to 5 seconds.
Direct
Use this mode if you do not run vCenter to manage your ESXi hosts, or as the fallback when vCenter is not available. It requires specifying credentials for each ESXi server, which can be different from the vCenter credentials.
Fallback to direct mode is not automatic unless the credentials are there.
When vCenter becomes unavailable, or its sensor is disabled, monitoring of an ESXi host switches to direct mode only if that host has its own credentials set. A host without them simply stops being monitored until vCenter returns.
If vCenter maintenance should not create a monitoring gap, set per-host credentials while everything is working.
ESXi View
The view gives you a comprehensive at the state of monitored ESX hosts.
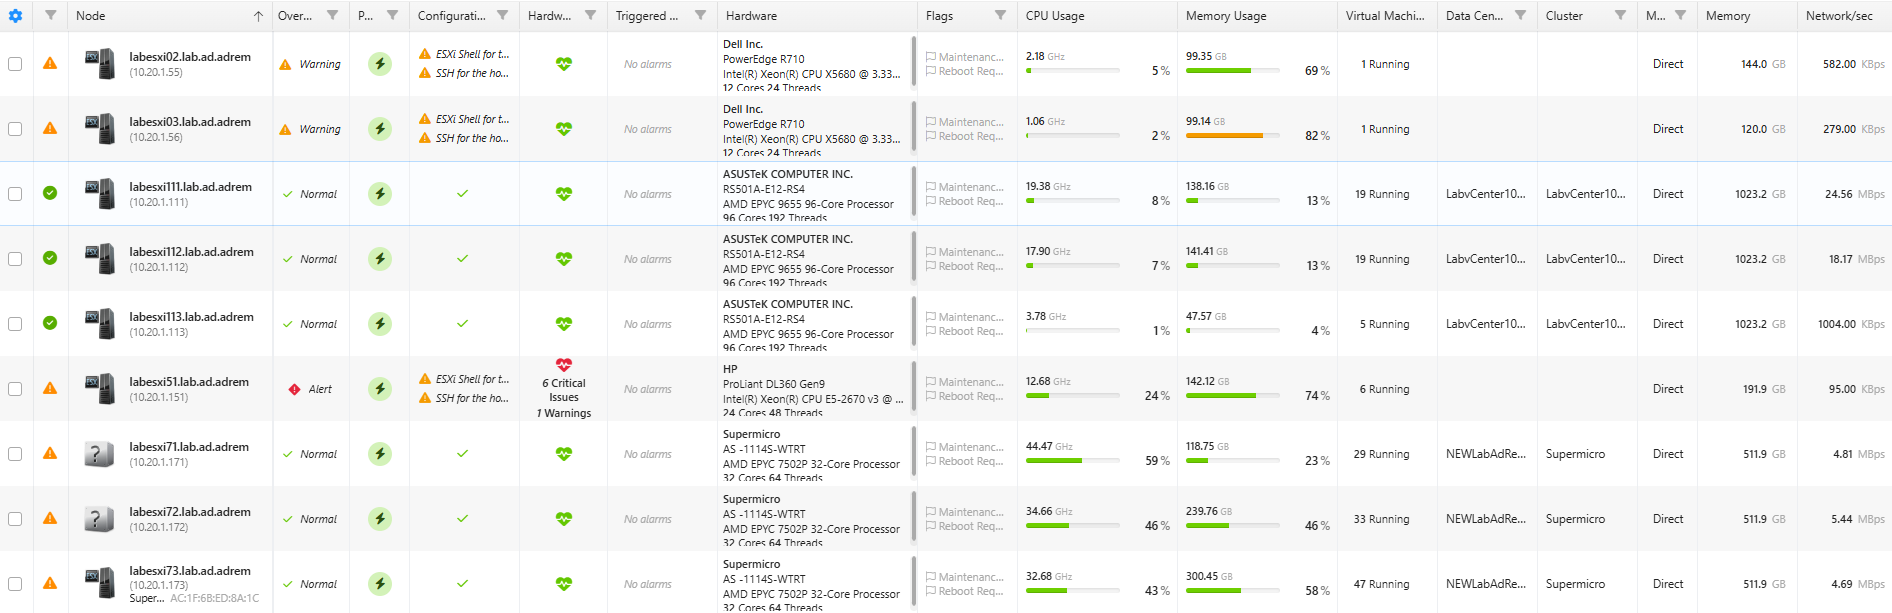
ESXi/VM View
You can see all information about all monitored Virtual Machines per map and on the Atlas level.
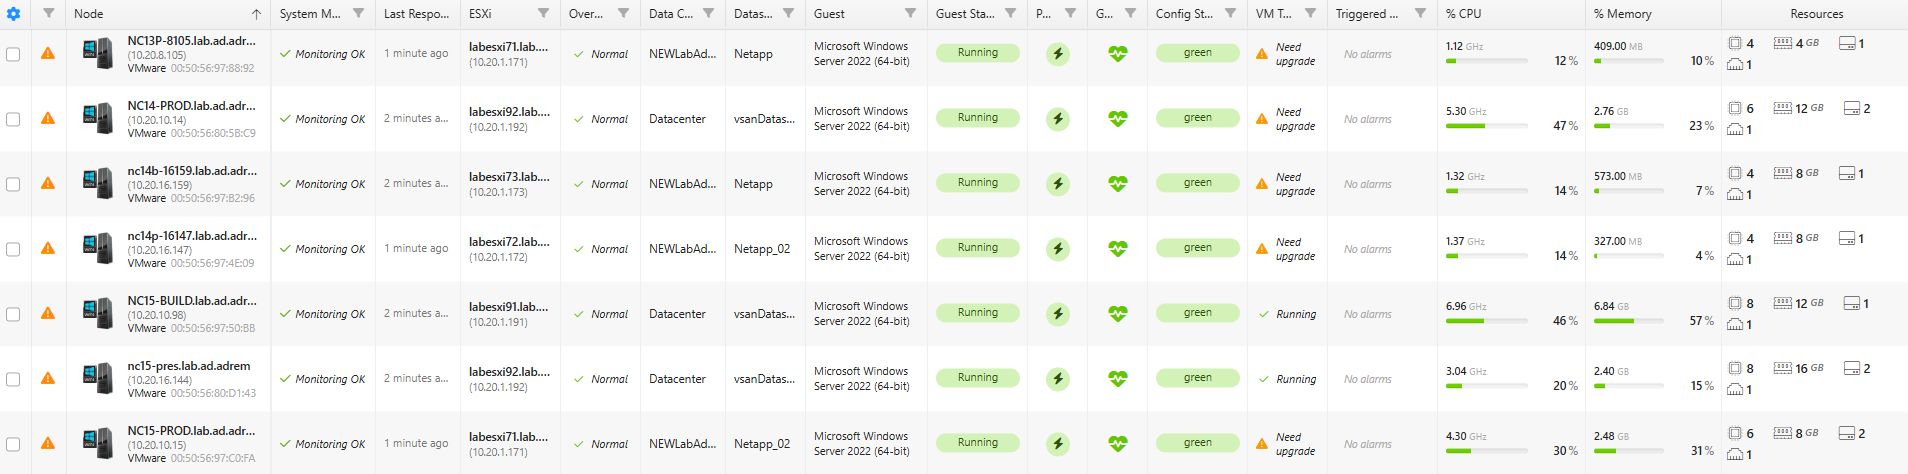
ESXi System Views

Virtual Machines
StatusSystem ViewsVirtual Machines
For each ESXi machine, NetCrunch lists all virtual machines running on the given ESXi. You can add the virtual machine to the Atlas to be monitored. It's possible only if the machine is running, and it has an IP address assigned.
Datastores
StatusSystem ViewsDatastores
NetCrunch allows the monitoring of VMware data stores. You also see their properties in the node status window.
Hardware Status
StatusSystem ViewsHardware Status
NetCrunch tracks all hardware statuses provided by the ESX server.
Counters can be monitored by ESX or using the VM machine instance Counters.
Performance Counters
NetCrunch provides counters for both the host ESX system and guest VM.
You can set triggers on those values using Event Triggers for Counters.
Datastore - Counter Object
- % Free Space
- Capacity Bytes
- Free Space Bytes
- Host Count
- Uncommitted Space Bytes
- Virtual Machine Count
Summary - Counter Object
The object provides performance counters for a given ESX server.
- % CPU Usage
- % Memory Usage
- Disk IO rate Bytes per sec.
- Network Utilization Bytes per sec.
- Running VM Count
- Total VM Count
- Up Time
- Used CPU Hz
- Used Memory Bytes
Virtual Machine -Counter Object
The object provides performance counters for a given guest system (VM).
- % CPU Usage
- % Guest Memory Usage
- % Host Memory Usage
- Disk IO Rate Bytes per sec.
- Guest Used Memory Bytes
- Host Used Memory Bytes
- Network Utilization Bytes per sec.
- Used CPU Hz
Alerts
If you want to add alerts to the single ESX server, go to Settings Alerting & Notifications Monitoring Packs and Policies. You can add new or overwrite alert rules defined by ESX Monitoring Pack.
ESXI Alert Types
- Alert on ESXi Hardware Status change
- Alert on ESXi Alarm state
- Alert on Performance Counter Threshold
The other option is to modify ESX Monitoring Pack and then go to Monitoring > Monitoring Packs & Policies and edit the selected monitoring pack located in the VMware section.
Adding ESXi guests
Node SettingsMonitoringESXi
You may decide to add each guest system to NetCrunch automatically. Each guest will be automatically monitored according to the defined Automatic Monitoring Packs.
The option is disabled by default.
When the option is enabled, and you want to remove a VM guest from Atlas, you need to set a specific exclusion in the Network View. Otherwise, the machine will be added over and over again.
Guest Status is taken directly from VMware (ESX) - therefore, the Machine which won't respond to any service check may be marked as 'down' while guest status is marked as 'running.'
vm-migration
When a VM Moves to Another Host
A guest that has been added to the atlas as its own node survives migration — vMotion, Live Migration or the Proxmox equivalent. The node is not deleted and recreated, and there is nothing to do by hand.
What happens is a re-association rather than a rediscovery:
- The node is matched by IP address, not by the host it used to be on. Its VM UID is preserved.
- When the new host's hypervisor sensor next enumerates its guests and finds the VM, the node's virtualization host is updated to point at that host.
- The old host stops listing the VM, so its reference is cleared once the guest is gone from that host's inventory.
- The VM's own monitoring follows it. Data is collected from whichever host currently owns the guest, with no user action.
Because both sides of that update happen on the hosts' own polling cycles, there is a short transition window in which the node shows no host at all — the old host has dropped it and the new one has not yet reported it. That is expected, and it resolves on the next sync.
Re-association depends on the IP address. If the guest's address changes during the move, or the VM reports no address at all, NetCrunch has nothing to match on and the node may not be linked to its new host automatically.
This is the one migration case that needs a person: check the node's virtualization host after a move that also changed addressing.
The same applies to the other hypervisors NetCrunch monitors per guest — Hyper-V and Proxmox VE — since the matching works the same way for all of them.