
Alert Views
Active Alerts
Active Alerts is one of the essential views showing current unresolved issues. NetCrunch tracks the state and correlates all internal events. When defining alerts for external events (SNMP, syslog, etc.), you can easily correlate by defining events that can close the alert.
This separate view shows only current alerts instead of forcing administrators to browse the history event log, which offers a history of all alerts. You can synchronize the Alert view with the Atlas Tree Window to change the Alerts window when you change the current view.
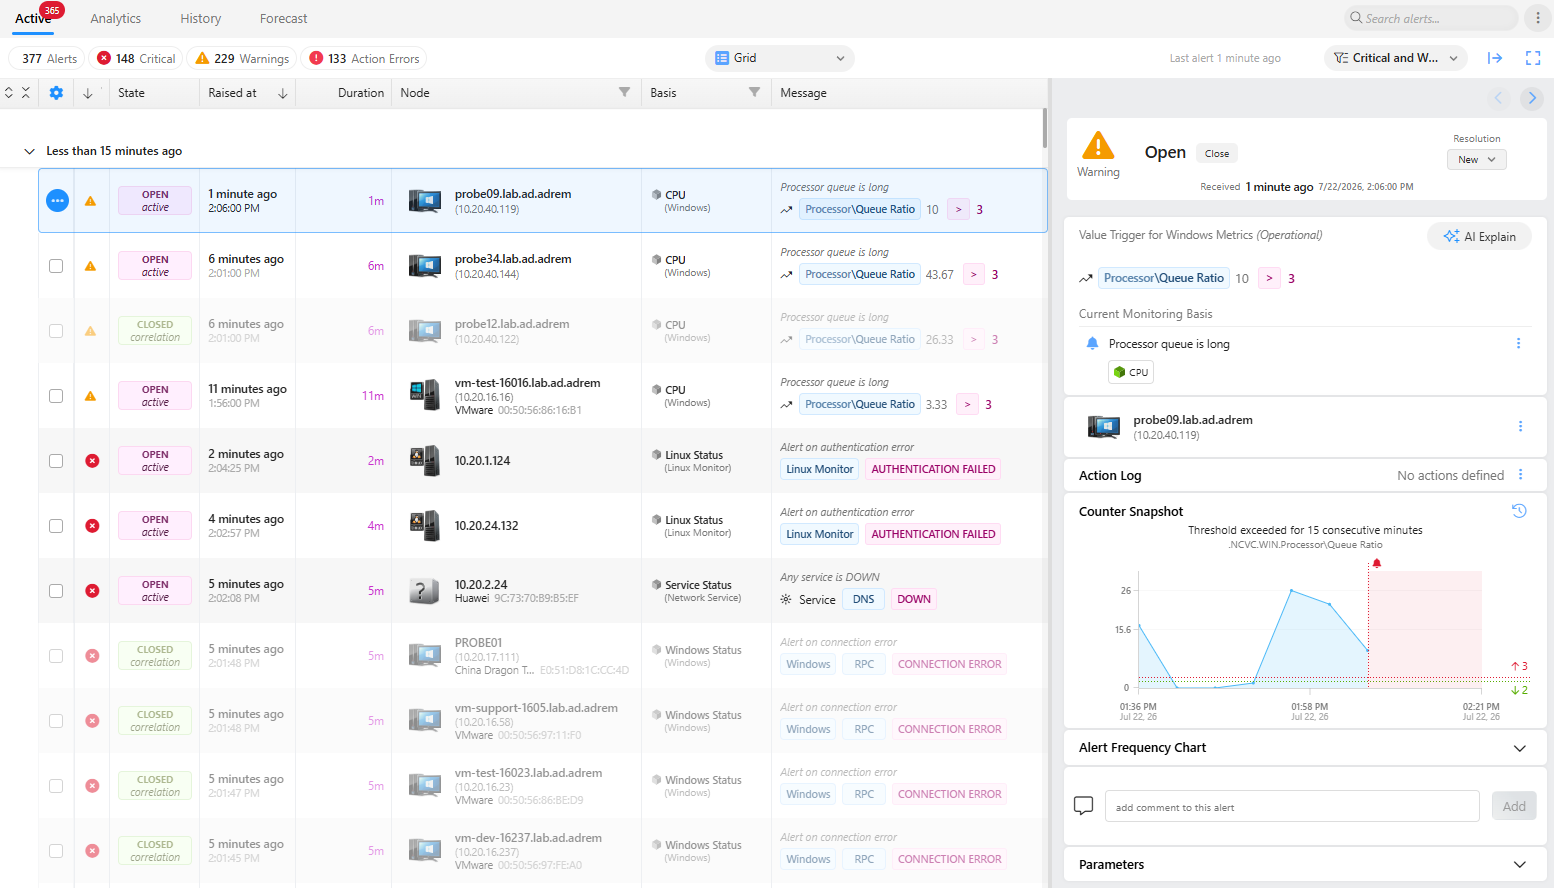
Grid
The Grid (Table) view offers enhanced capabilities for sorting and filtering alerts. This view provides a structured and detailed overview, allowing you to easily organize and pinpoint specific alerts based on various criteria. It's ideal for in-depth analysis and quick identification of important alerts.
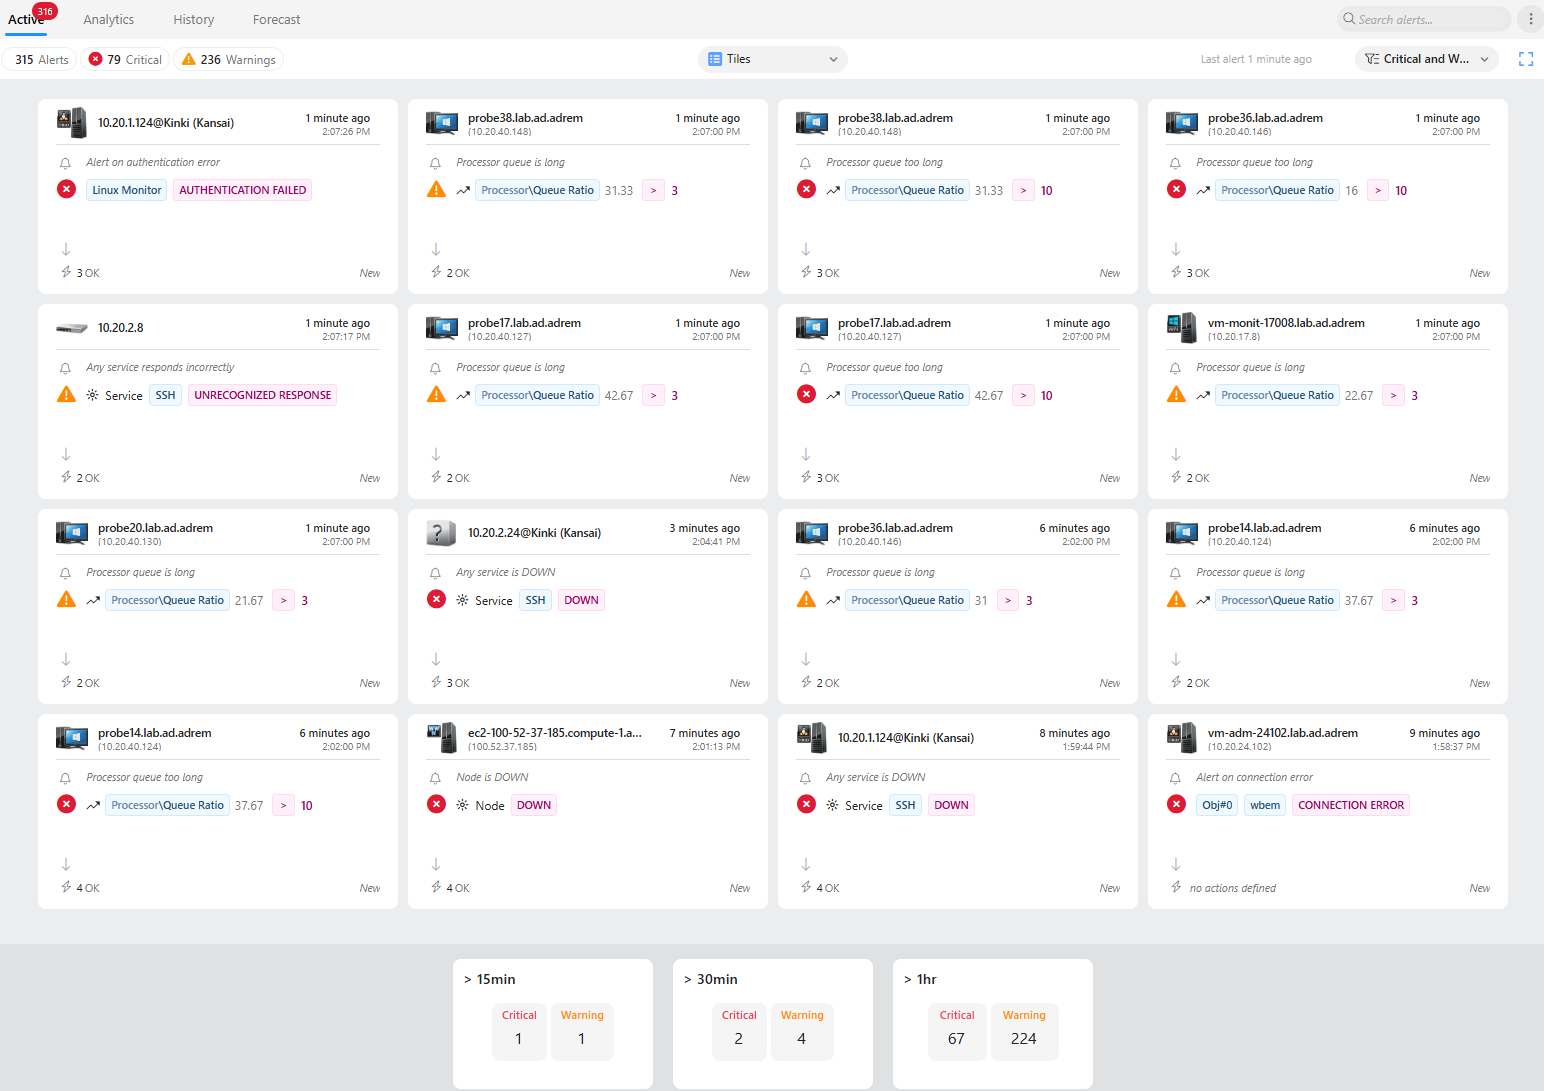
Tiles
The Active Alerts Tiles view provides a dynamic dashboard for monitoring the latest active alerts. It highlights the most recent and important alerts, with animations to help you notice new alerts as they appear and observe closed alerts fading away.
Analytics
This view displays the number of alerts generated in the three time ranges (24 hours, 7 days, and 30 days). Additionally, it includes information about nodes with the most alerts, top critical and warning alerts by type, and statistics related to the number of alerts in custom views.
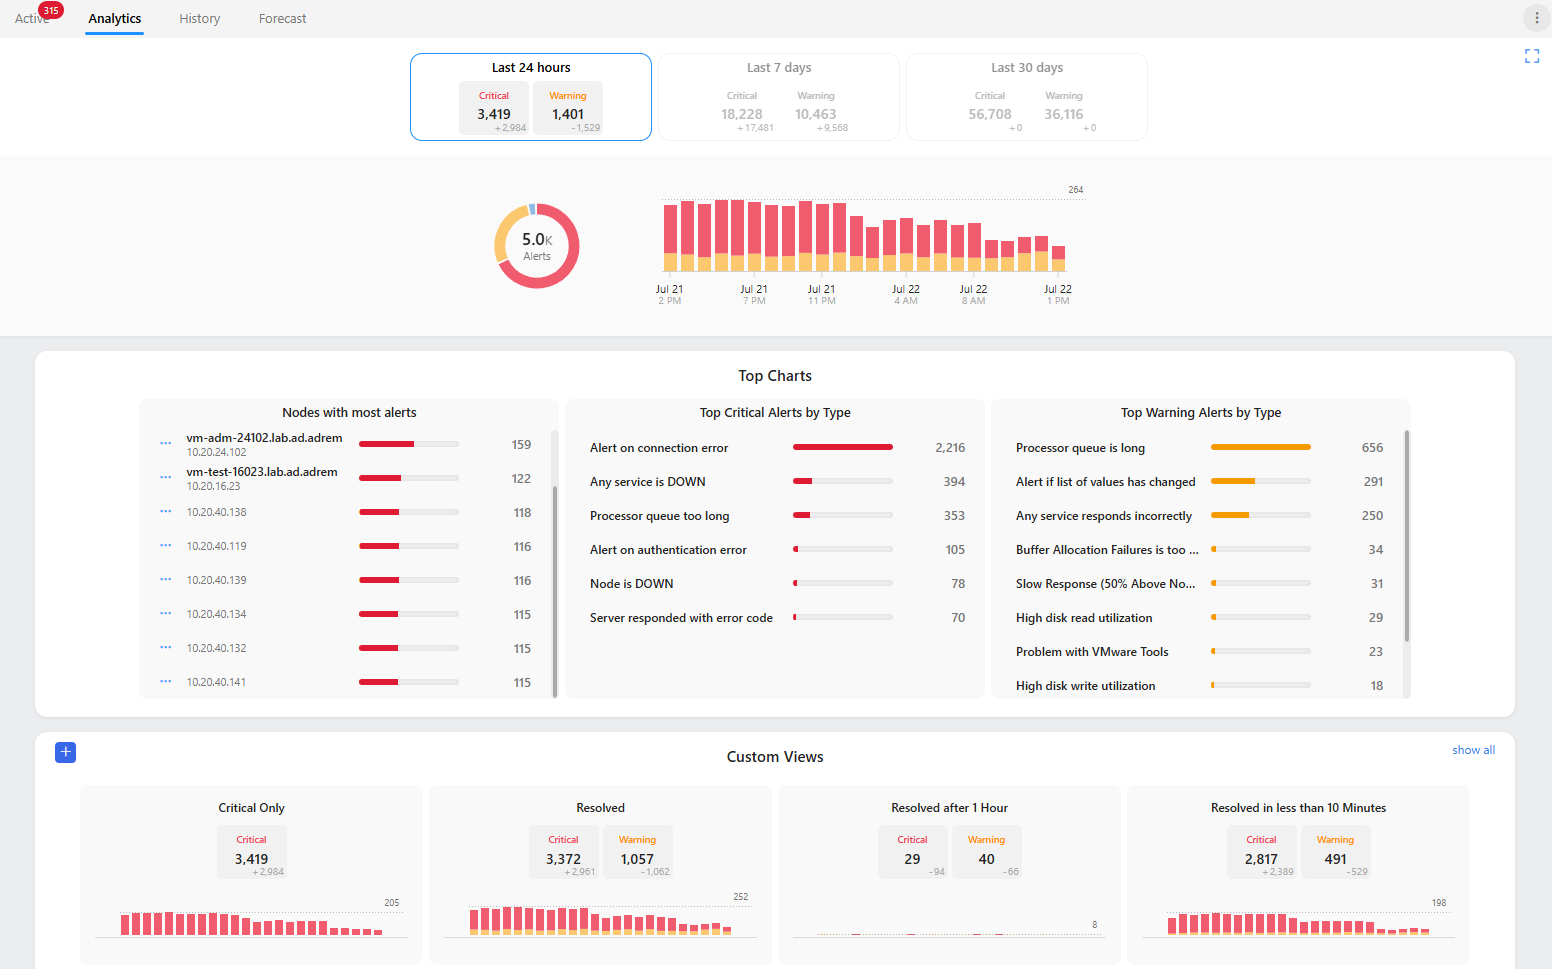
Every chart element is clickable and automatically brings you to the appropriate history view to dig deeper and see all selected events.
History - Event Log Views
NetCrunch offers many predefined event log views and allows you to create custom views using an intuitive query builder. Views can be saved and used for any node group in the Atlas.
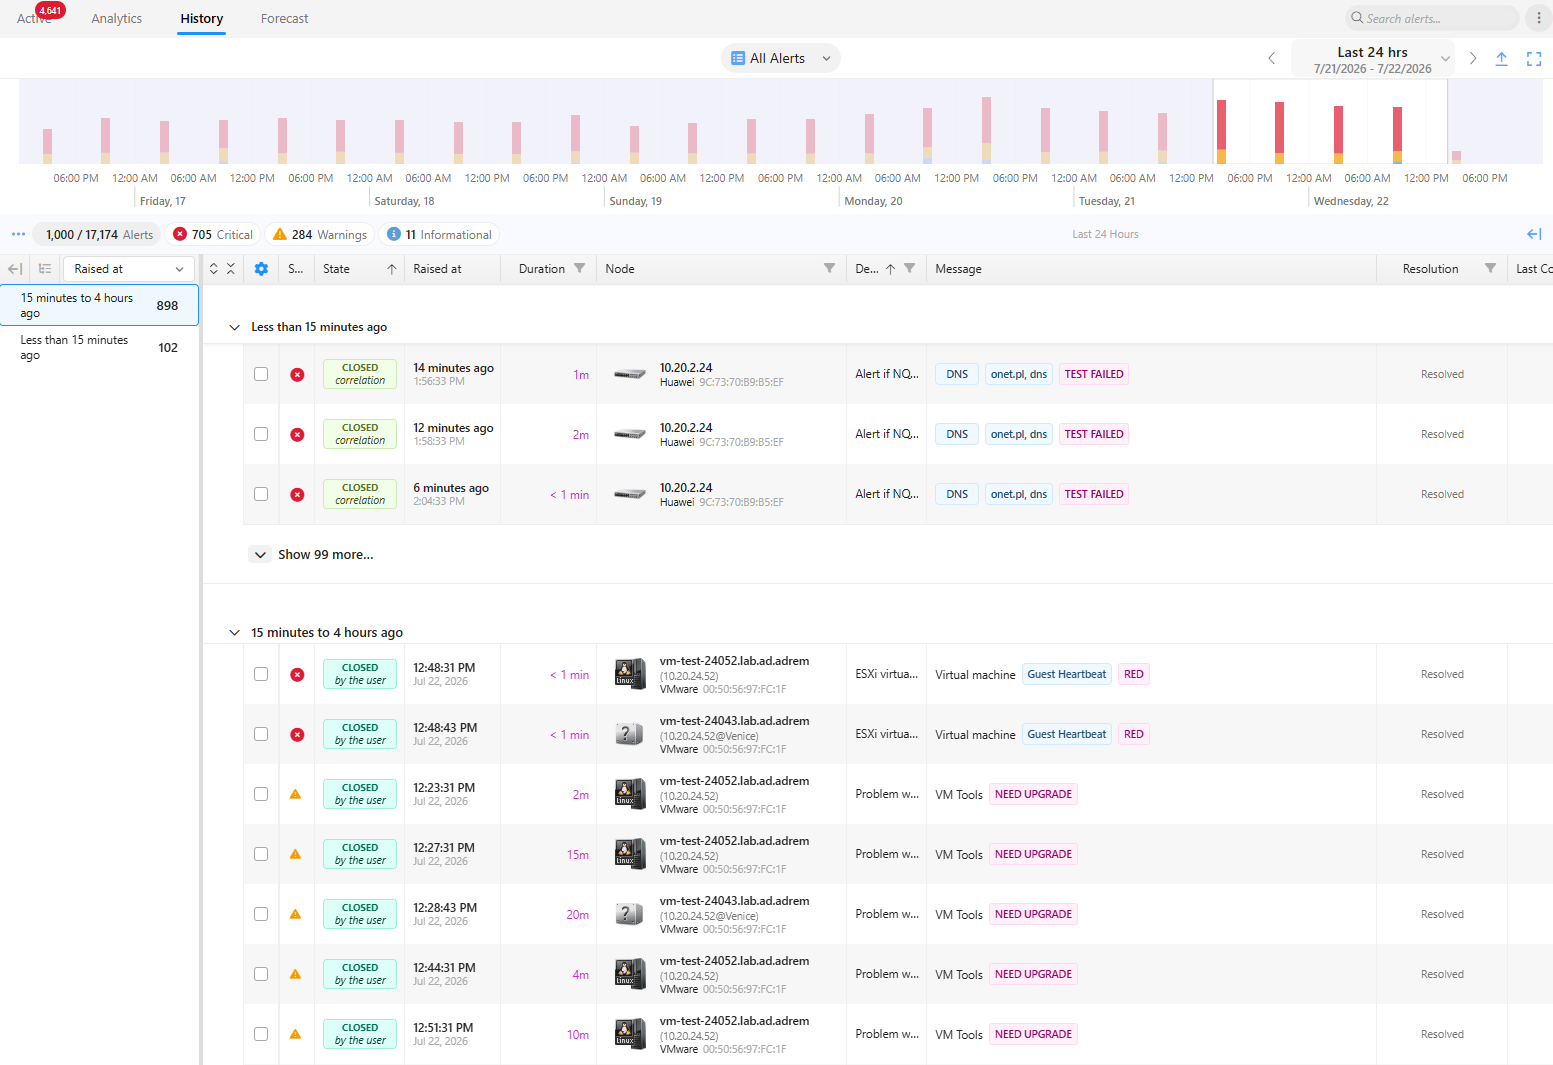
You can select the view by dropdown in the center of the header, or you can easily build a new view. Read about Managing Event Log Views
Event Details
The Event Details window offers much more than just displaying more details. It allows you to check why this alert happened and its parameters, and you can change it or disable it for a particular node,
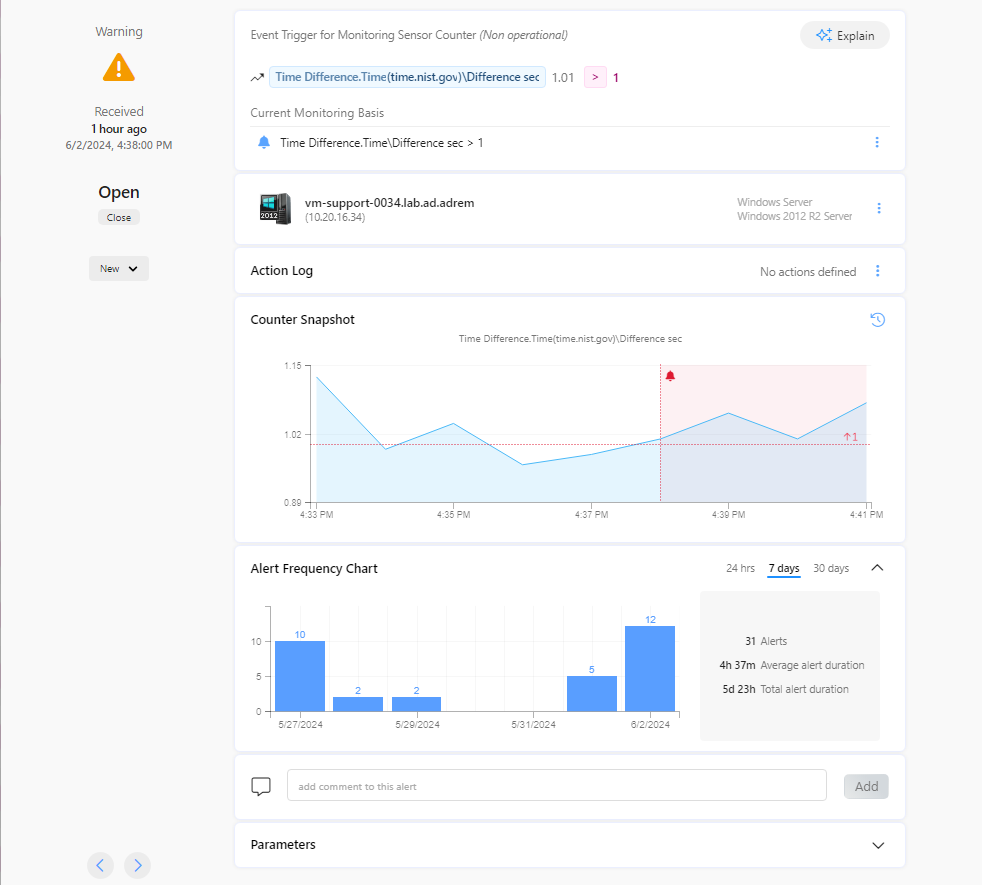
It allows you:
- Reviewing alerting actions execution log
- Checking where the alert is defined
- Adjusting alerting rule (condition)
- Changing alerting action script
- Making an exception by disabling the alert for the node
- Adding comments
- Analyzing alert occurrences in the past
- Modifying Monitoring Pack the alert is part of
- Reviewing all alert parameters
- Changing alert resolution state
This window also shows all executed actions and links to the event that closed a given alert.
If a performance counter value has triggered the alert, the Details view displays a chart showing values at the time of the alert.