
NetCrunch Connections
Learn how clients and remote components connect to the NetCrunch Server — locally, through HTTPS, or via the NetCrunch Connection Cloud (NCC). Understand supported protocols, security levels, and available connection types.
Accessing NetCrunch
NetCrunch supports various connection types to enable access from consoles, browsers, remote probes, and external systems. Depending on your environment, you can use direct TCP, HTTPS, or NCC to securely connect.
Clients
NetCrunch allows connections from several types of clients:
- Desktop Console
- Web Console (Browser)
- Monitoring Probes
- API Clients & Webhooks
Administration Console (Desktop)
The NetCrunch Administration Console is the most powerful and optimized client, designed for fast, real-time interaction. It caches a large amount of data locally and synchronizes only the changes with the server, providing high responsiveness and reduced load.
It supports fine-grained access control, so it is no longer limited to administrators. Users with proper access rights can perform limited administration tasks — such as managing specific nodes or views — without requiring full administrative privileges.
Supported Systems
- Windows 8 or newer (recommended: Windows 11)
- Supports multi-monitor and touch devices
Connection Methods
- Encrypted TCP – Use server address or name (port
12009) - Secure WebSocket (HTTPS) – Connect via Web Server (
wss://your-server) - NCC (Cloud) – Use license ID (e.g.,
YZ-123-456) as the connection key
Features Exclusive to the Admin Console
- Configure monitors, sensors, and monitoring packs
- Manage alerting policies and response actions
- Edit node properties and apply monitoring roles
- View full alert and event history
- Use diagnostic tools: Logs, SNMP Tools, Perfmon Explorer
- Import/export configuration templates
- Access Object Explorer and MIB Browser
- Manage NetCrunch modules and task schedules
- Delegate limited admin permissions per view or node
- Faster performance than the Web Console due to local caching
Web Console (Browser)
The Web Console provides access through modern HTML5 browsers and is ideal for remote visibility and lightweight tasks.
Features
- View and edit Graphical Views
- Browse Atlas Tree, Events, and Reports
- Role-based access per user or group
- Excellent for executives or helpdesk roles
Supported Browsers
- Edge 86+, Safari 15.4+, Chrome 86+, Firefox 86+, Opera
- Internet Explorer is not supported
auto-reconnection
Staying Signed In
Selecting Remember me at sign-in makes the session persistent. Closing the browser no longer ends it — reopening the Web Console restores the previous session directly, in the same way a page reload does, without asking you to sign in again.
The session is held by a key stored in the browser, and the key rotates: each time a session is restored, the old key is spent and a new one issued. A key that has been used cannot be used a second time.
The stored key is discarded when you sign out explicitly, or when you clear it from the interface.
Because the session survives closing the browser, signing out matters on a shared or public machine. Simply closing the window leaves the session restorable by whoever opens the browser next.
Monitoring Probe
The NetCrunch Probe is a remote monitoring engine designed to operate behind NAT/firewalls in branch offices or customer sites.
Connection Methods
- TCP (12009) – Standard encrypted connection to the server
- NCC Cloud – Simplest and most secure method
Sending Data to NetCrunch
External data can be pushed into NetCrunch through:
- Webhooks for status and event injection
- REST API for metrics and status objects
- Data Parsers for log or file-based input
Security & Protocols
NetCrunch supports multiple access paths. Each has a different level of security and use case:
Direct TCP (Encrypted on Port 12009)
- Security: High
- Encrypted connection using X25519 key exchange, AES-256-GCM encryption, and mutual PSK authentication
- Provides TLS-level security with FIPS 140-3–compatible cryptography, without requiring certificates
- Used by the Desktop Console and Probes to connect to the NetCrunch server
While port 12009 can be exposed to the Internet, we recommend placing the server behind a reverse proxy such as NGINX to provide an additional layer of protection against network-based attacks and unauthorized access attempts.
HTTP
- Security: Low
- Unencrypted, not suitable for production
HTTPS (Self-Signed)
- Security: Medium
- Encrypted, browser warnings expected
HTTPS (Valid Certificate)
- Security: High
- Full encryption + certificate validation
- Required for secure WebSocket (
wss://)
NetCrunch Connection Cloud (NCC)
- Security: High
- Requires no port forwarding or NAT traversal
- Works via outbound HTTPS (port 443)
-
Supports:
- Desktop Console
- Web Console
- Remote Probes
Use @<license-id> as the server address when connecting (e.g., @YZ-123-456).
Communication Scenarios
The following diagram summarizes the three common deployment scenarios:
- Local Deployment (LAN) – Direct TCP & HTTPS
- HTTPS-Only Deployment – For DMZ or simplified security models
- Cloud Relay (NCC) – No inbound traffic needed
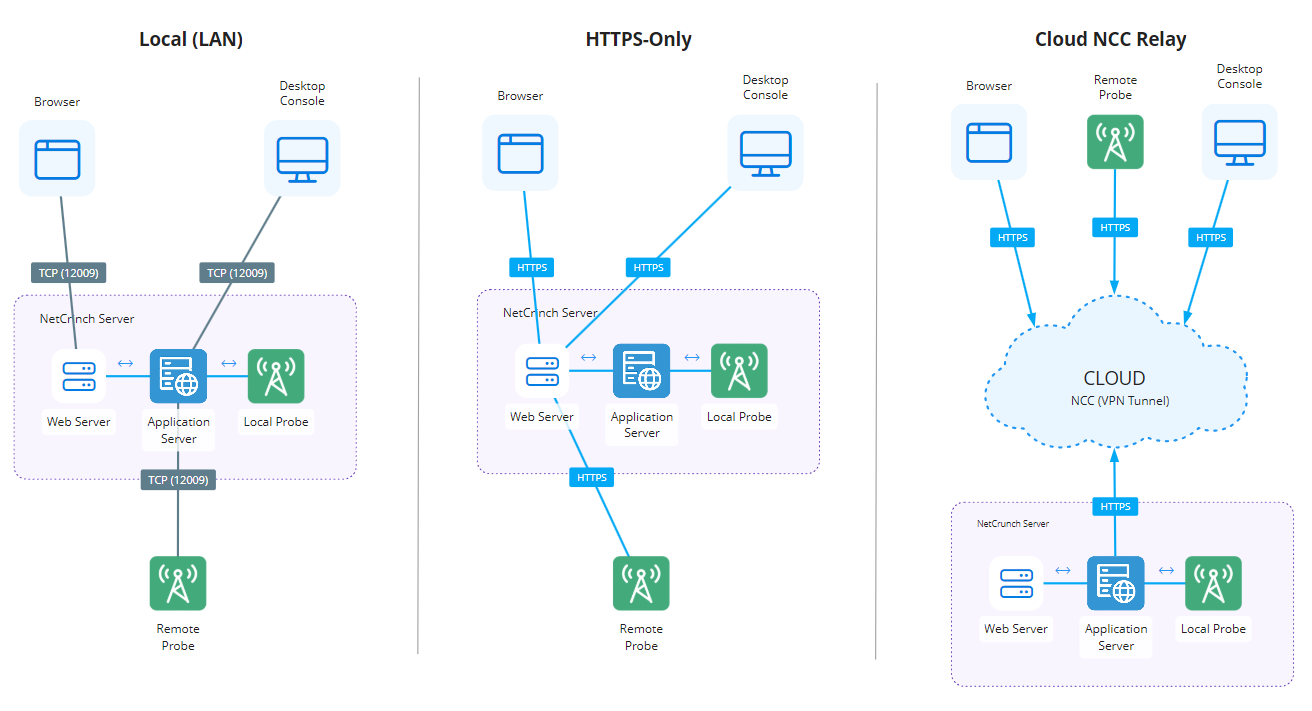 Diagram created using NetCrunch Graphical Views.
Deployment Considerations
- In HTTPS-only mode, all connections to the server are inbound and encrypted. This typically requires firewall rules or a reverse proxy (e.g., NGINX, HAProxy) in front of the NetCrunch server to properly route and secure access.
- In Cloud Relay (NCC) mode, the server initiates a single outbound HTTPS connection (port 443) to the NCC relay. No inbound connectivity is required.
This architecture is highly resilient and an ideal solution for zero-trust environments, where inbound ports are blocked, and all communication must be explicitly initiated and authenticated.
Related Topics
- What Is a Node in NetCrunch?
This topic explains the definition of a Node in NetCrunch. It clarifies why a Node is treated as a service endpoint rather than a physical device, and how this distinction improves monitoring accuracy for modern infrastructure.
- What can I monitor?
NetCrunch can monitor nearly anything: devices, applications, systems, databases, and files. The program can be extended using scripts; data from various sources can be sent to NetCrunch or polled from files, databases, or websites.
- NetCrunch Connection Cloud (NCC VPN)
A resilient, secure platform for zero-configuration access to NetCrunch from any location — ideal for modern, zero-trust environments.
- Sending Data to NetCrunch
Read how to send data to NetCrunch and create a custom monitor. You can easily turn any application or script into a NetCrunch agent.
- Azure API Management Sensor
Azure API Management sensor allows you to monitor the performance and behavior of the Azure API Management service. Azure API Management is a reliable, secure, and scalable way to publish, consume and manage APIs running on the Microsoft Azure platform.
- Azure Cosmos DB Sensor
This sensor monitors Azure Cosmos Database Service using Azure Monitor metrics.
- Azure Cost Sensor
The sensor monitors the estimated cost of resources in Azure subscription, and the progress of expenses within budgets defined in Azure subscription.
- Azure Insights Components
Azure Insights Components Sensor monitors Azure Insights Components resource, using Azure Monitor metrics. Application Insights is a feature of Azure Monitor and an extensible Application Performance Management (APM) service. You can use it to monitor your live applications. It will automatically detect performance anomalies and includes powerful analytics tools to help in diagnosing issues and understanding what users do with the app.
- Azure Logic Apps Sensor
Azure Logic Apps sensor allows you to monitor the performance and behavior of the Microsoft Cloud technology called Azure Logic Apps. Azure Logic Apps is a service in Microsoft Cloud that allows you to schedule, automate, and orchestrate tasks, business processes, and workflows when you need to integrate apps, data, systems, and services across enterprises or organizations.
- Azure Server Farm Sensor
Azure Server Farm Sensor monitors Azure Server Farm resources, using Azure Monitor metrics. The Microsoft Server Farm simplifies the provisioning, scaling, and management of multiple servers for administrators and hosting providers.
- Azure Service Bus Sensor
Azure Service Bus sensor allows monitoring the metrics of the cloud apps connected to the Service Bus namespace. Azure Service Bus is a messaging service on the cloud used to connect any applications, devices, and services running in the cloud to any other applications or services. As a result, it acts as a messaging backbone for applications available in the cloud or across any device.
- Azure Storage Account Sensor
Azure Storage Account Sensor monitors Azure Storage Accounts service, using Azure Monitor metrics. Microsoft Azure Storage Accounts service allows to create a group of data management rules and apply them all at once to the data stored in the account: blobs, files, tables, and queues.
- Azure Web Site Sensor
With the Azure Web Site sensor, you can monitor the usage and performance of the web applications that are deployed to the cloud with Azure Web Apps. Azure Web Apps is a managed cloud service that allows the deployment of a web application and makes it available to customers on the Internet in a very short amount of time.
- AWS Alarm Sensor
The Alarm Sensor monitors the status of Amazon alarms with CloudWatch API.
- AWS Auto Scaling Sensor
AWS Auto Scaling Sensor monitors the parameters of AWS Auto Scaling Group. AWS Auto Scaling automatically adjusts capacity to maintain steady, predictable performance for your applications.
- Azure SQL DB Sensor
This sensor allows you to monitor the performance and behavior of the databases managed in Azure SQL DB. Azure SQL DB is Microsoft’s cloud database service, that enables organizations to store relational data in the cloud and quickly scale the size of their databases up or down as business needs change.
- AWS Cost Sensor
The sensor monitors the estimated cost of services in the AWS cloud and the progress of expenses within AWS Budgets.
- AWS EBS Sensor
The sensor allows monitoring of key metrics of AWS Elastic Block Store.
- AWS EC2 Sensor
AWS EC2 Sensor allows monitoring usage of Amazon Cloud service Elastic Compute Cloud (EC2) Instance resources.
- AWS ElastiCache Sensor
AWS ELB Sensor allows monitoring of the performance of the AWS ElastiCache service.
- AWS ELB Sensor
AWS ELB Sensor allows monitoring metrics of AWS Elastic Load Balancers.
- AWS SQS Sensor
AWS SQS Sensor allows monitoring of key metrics of AWS Simple Queue Service (SQS). SQS is a fully managed message queuing service that enables you to decouple and scale microservices, distributed systems, and serverless applications.
- Cloud Drives
This sensor allows monitoring of Microsoft OneDrive storage usage.
- Microsoft 365 Service Status
This sensor allows you to monitor the health of Microsoft 365 services.
- Cisco Meraki Cloud
This monitoring solution provides visibility into Cisco Meraki cloud-managed wireless infrastructure, including device availability, wireless performance, network client statistics, connection health, and license status using the Meraki Dashboard REST API.
- External Event Sources
See how to create an alert for Syslog messages, SNMP traps, Web Messages, and Windows Event Log entries.
- - Receiver - External Events Window
The window allows to see all incoming traps and syslog messages and define alerts with a single click.
- IP Tools - Remote Network Diagnostic
Overview of NetCrunch IP Tools as remote-capable diagnostic utilities available in both Desktop and Web Console, with flexible execution backends including server, probes, and NCC.