
Node Status Overview – Real-Time Monitoring & Context
The Node Status window in NetCrunch provides a comprehensive, real-time view of a monitored node’s condition. It includes monitoring status, performance metrics, activity logs, system properties, dependencies, alerts, and more. For Windows, Linux, hypervisors, and network devices, NetCrunch presents unmatched visibility in a unified interactive interface.
Overview
The Node Status window is the central panel for accessing complete, live information about any monitored node. The layout dynamically adapts to the type of node—Windows, Linux, ESXi, switches, routers, or others—and presents tabs that combine monitoring data with configuration and historical insights.
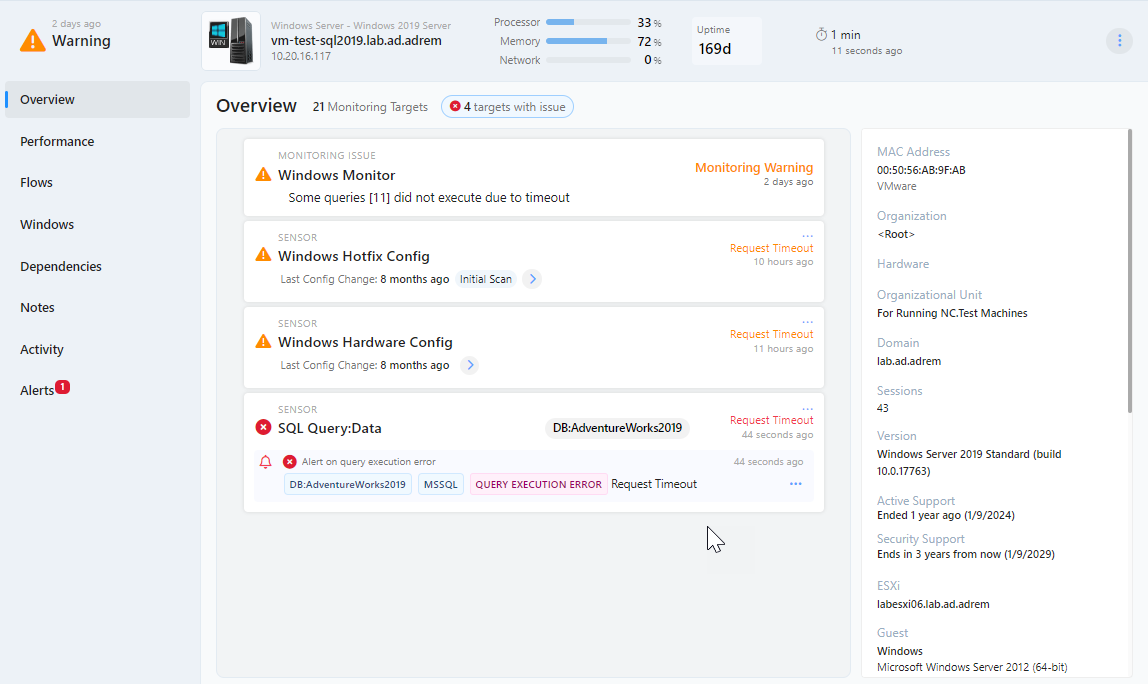
It provides:
- A unified entry point for monitoring and diagnostics
- Immediate access to alerts, trends, counters, and hardware/software state
- Deep system visibility without the need for agents
- Actionable views with remote control over processes and services (Windows)
Left Navigation Tabs (Context-Sensitive)
The following tabs may appear depending on node type:
- Overview – Overall health, monitoring targets, recent events, system metadata
- Performance – Visual charts of monitored counters (CPU, memory, disk, network)
- Windows – Advanced monitoring for Windows systems (see below)
- System – Linux/Unix process and network views
- Sensor Views – Specific to monitoring sensors on a given node
- ESXi – VMware-specific views for hosts, guests, and storage
- Interfaces – Switch/router interface metrics, VLANs, errors
- Dependencies – Live map of upstream/downstream connections
- Notes – Editable note log for operational documentation
- Activity – Monitoring activity log for changes, failures, actions
- Alerts – List of current and past alerts for this node, linked to counters
Windows Tab (for Windows Nodes)
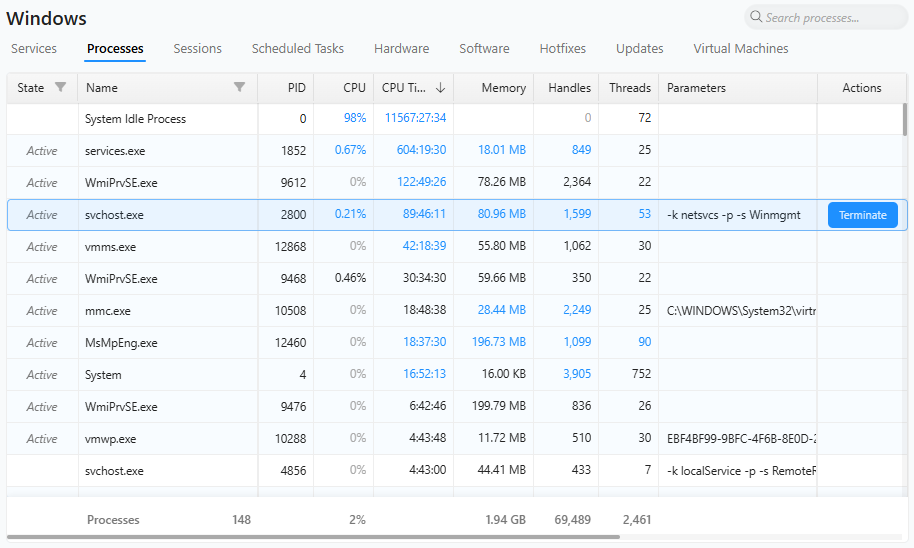
The Windows tab includes specialized subviews offering live data and change tracking—not just static status.
● Services
- List of system services with real-time status
- Control actions: Start, Stop, Restart remotely
● Processes
- Live process list with CPU/memory usage
- Allows remote termination of selected processes
- Helps detect hung or runaway applications
● Sessions
- Displays currently active RDP or local sessions
- Username, session type, and login time
● Scheduled Tasks
- Lists scheduled tasks from Task Scheduler
- Includes last run time, status, and next run
● Hardware
- Monitors key physical components (CPU, RAM, disks, BIOS, etc.)
- Tracks hardware configuration changes over time
- Compares current vs. previous inventory states
● Software
- Displays all detected changes in installed applications
- Tracks installs, uninstalls, and version updates
- Allows comparison of software state across time
- Helpful for auditing unauthorized or unexpected deployments
● Hotfixes
- Lists installed Windows updates (KBs)
- Includes timestamps and versioning
- Change view highlights when updates were added or removed
● Updates
- Summarizes current state of pending and installed OS updates
- Gives visibility into patching status
- Complements Hotfixes by showing system update queue
● Virtual Machines (Hyper-V only)
- Lists VMs hosted by this Hyper-V node
- Displays resource usage and state of each guest
All of these views support historical snapshots, comparisons, and are part of NetCrunch’s monitoring layer—not just informational screens.
System Tab (for Linux/Unix Nodes)
The System tab includes runtime diagnostics for:
- Processes – Live view of running processes and usage
- Opened Files – Real-time file descriptor access
- TCP Connections – Active and listening sockets
- Sockets – Summary grouped by protocol and type
These are pulled via SNMP and SSH, offering high-value operational insight without installing agents.
ESXi Tab (for VMware Hosts)
When connected to VMware APIs, NetCrunch displays:
- Hardware Status – Health metrics: fans, sensors, temperatures
- Virtual Machines – List of all VMs with power state and metrics
- Datastores – Storage capacity, usage, and provisioning status
This gives full visibility into virtualization infrastructure from a single screen.
Interfaces Tab (Switches and Routers)
For network gear, the Interfaces tab displays:
- Interface list with operational and admin status
- Live traffic metrics (in/out throughput)
- VLAN assignments
- Packet errors and discards
- Link speed and duplex state
Each port includes a detailed popup with visual charts and counters. Interactive elements allow quick pinpointing of overloaded or misconfigured ports.
Configuration & Inventory Change Tracking
Many subviews in the Node Status window support change history, not just current values.
Hardware / Software / Hotfixes
- NetCrunch tracks and stores changes in these categories over time
- You can compare any snapshot to previous states
-
Useful for investigating:
- Unauthorized software installs
- OS rollbacks or update issues
- Hardware swaps or reconfigurations
This makes NetCrunch function as a configuration monitoring solution, not just a performance monitor.
Device Configuration (Switches, Routers, Firewalls)
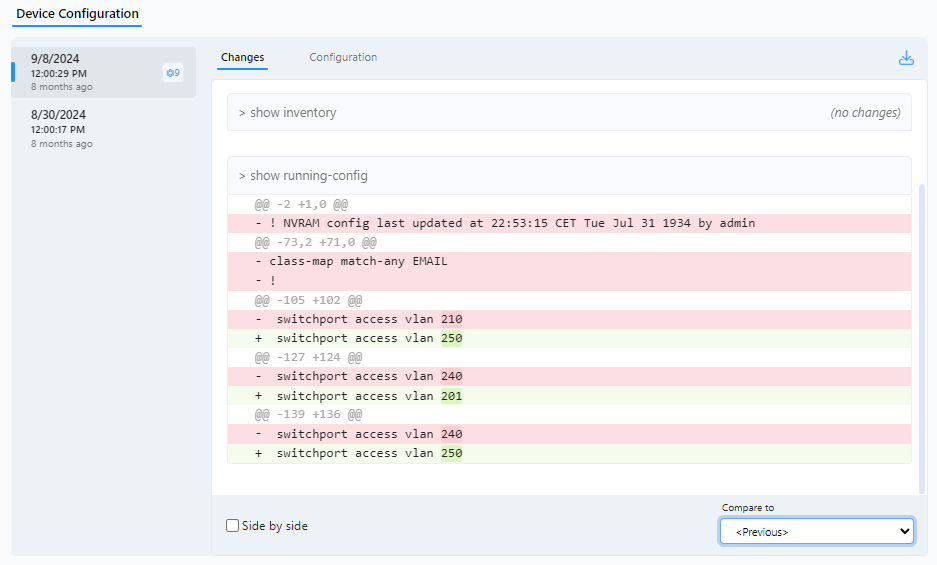
Network devices that support CLI access expose a Device Configuration tab:
- Runs commands like
show version,show configuration, etc. - Snapshots are versioned and compared automatically
- Line-by-line diff shows what changed and when
-
Use cases:
- Auditing switch/router config changes
- Detecting policy drift
- Backing up CLI configurations
NetCrunch’s Node Status window is a single-pane, deeply integrated monitoring console. It unifies status, alerts, trends, configuration, and change intelligence for all supported node types—live, historical, and interactive.