Network Traffic Monitoring
NetCrunch supports many flow protocols as application monitoring using Cisco NBAR.
NetCrunch supports two technologies that allow network traffic monitoring. The first gathers information from switches about the traffic on particular ports, and the second can collect flow data from routers and switches.
Monitoring Traffic on Switch Ports
Switches collect statistics about traffic on their ports, which are available in Physical Connections views. These views can give an overview of traffic between two switches or between the switch and servers.
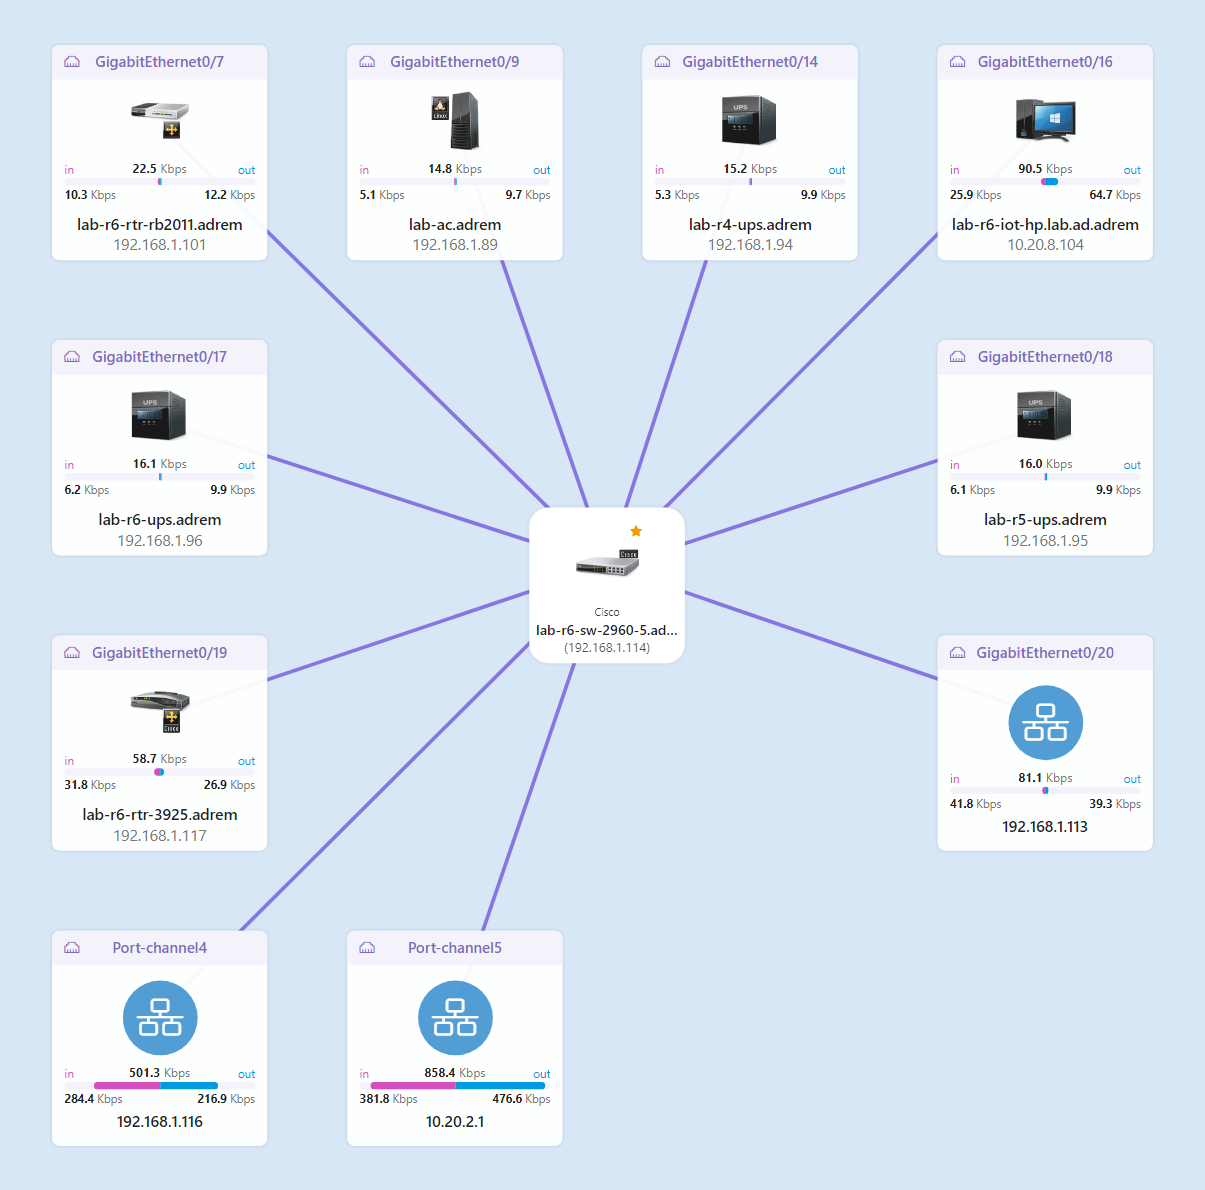
You can see aggregated traffic information in the last hour or the last 24 hours. When you select a link on the map, you can open the Connection Status details and the traffic history.
Monitoring Traffic with NetFlow
Introduction
There are many flow-export formats on the market today. Netflow is a Cisco trademark (aka cflow), but similar protocols include jFlow, rFlow, NetStream, AppFlow, and sFlow.
For the NetFlow suite of protocols, we often see version 5 (supported by most devices), some combined v5/v7 (the Catalysts), and some version 9 of the newer devices.
Supported Flow Technologies
NetCrunch supports the following flow protocols:
- NetFlow v1, v5, v8, v9, and IPFix,
- NetStream
- CFlow
- AppFlow
- rFlow
NetCrunch collects and analyzes received flows for aggregation in the 15-minute and 1-hour ranges. This allows you to analyze data in a short period and store long-term performance trends.
Currently, NetCrunch supports single flow aggregation to receive data from multiple flow sources. However, they are aggregated together on a single dashboard.
Performance
Currently, Netcrunch flows can receive up to:
~ 3000 packets/sec
~ 35000 flows/sec (average 12 flows per packet)
sFlow Disclaimer
NetCrunch is capable of receiving sFlow, but the protocol's statistical nature requires different processing and data aggregation over a much longer period.
NetFlow Views
NetFlow Dashboard
Overview Flows
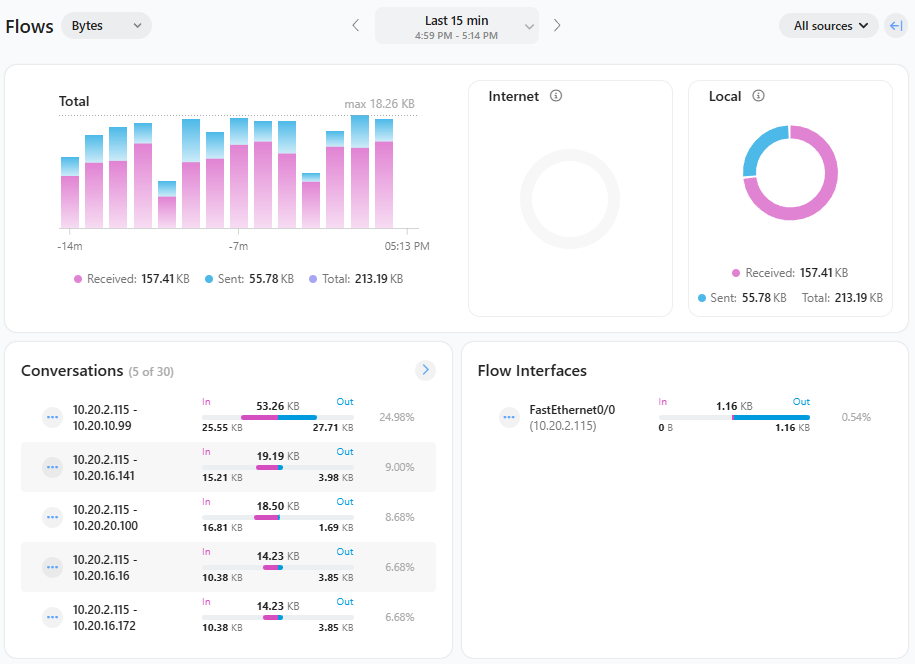
NetCrunch shows global flow traffic statistics on the top Atlas Dashboard. When you click on any chart bar, you can see traffic details for a selected element.
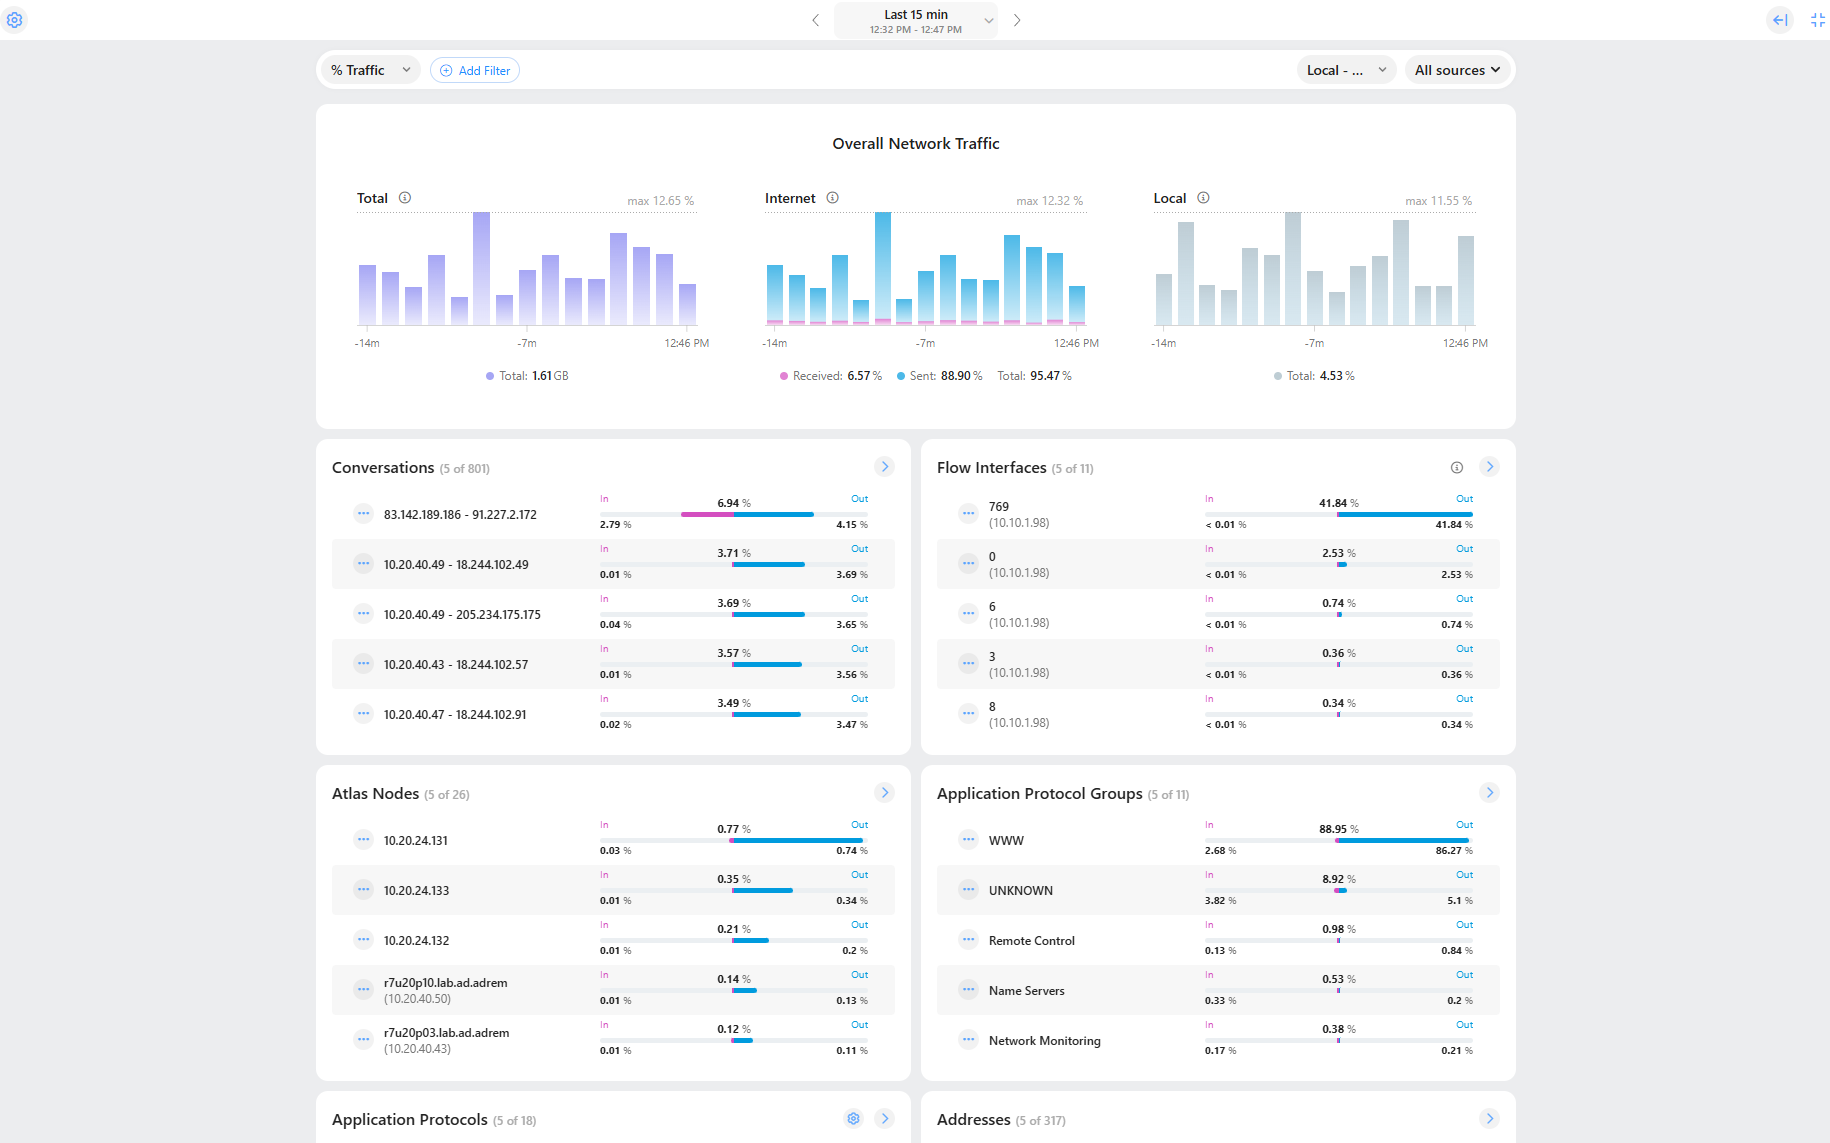
The view shows the current aggregated statistics from all flow sources sending data to NetCrunch.
Flow Analytics
NetCrunch allows you to analyze traffic using various criteria. The program allows you to create custom application definitions and supports Cisco NBAR technology for application monitoring.
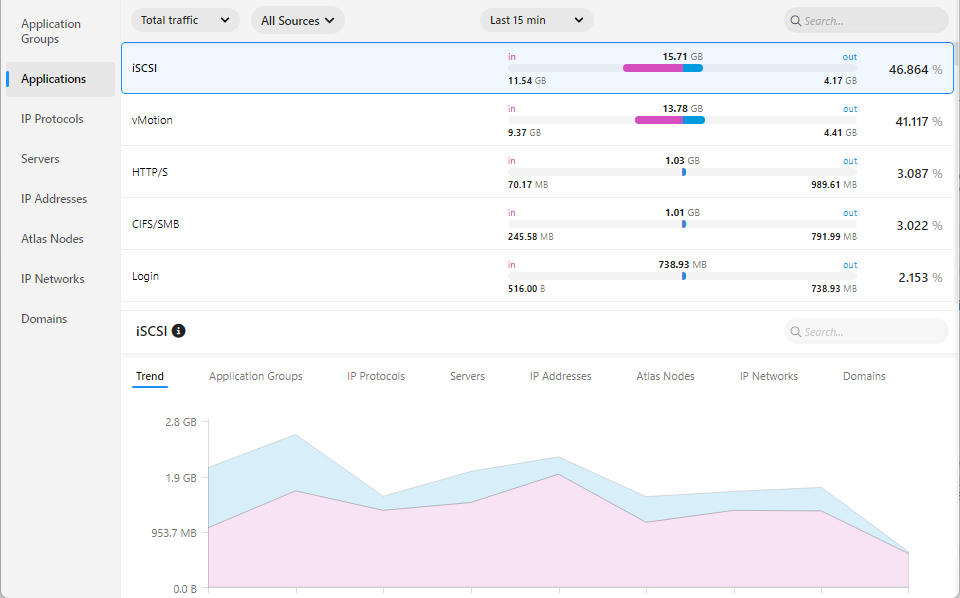
The program also allows the creation of custom application definitions based on protocol and ports.
Node Traffic