
Network Topology Maps
NetCrunch automatically builds network topology maps to visually represent logical routing and physical Layer 2 connections between network devices. These maps aid in understanding network structure, monitoring connectivity, and troubleshooting problems.
Introduction
Network topology maps in NetCrunch provide a dynamic, visual representation of how devices are connected and communicate across your network. These maps fall into two categories:
- Routing Maps (Logical Topology) – showing relationships between routers and IP networks.
- Physical Connection Maps (Layer 2) – illustrating port-level connections between switches and devices.
To generate accurate topology maps, NetCrunch relies heavily on SNMP data. SNMP must be enabled on your network equipment for NetCrunch to access the necessary connectivity and port mapping details. Fortunately, nearly all business-grade hardware supports SNMP, and NetCrunch includes a built-in MIB compiler for vendor-specific extensions.
By default, NetCrunch uses the following protocols to detect network structure:
- STP (Spanning Tree Protocol)
- CDP (Cisco Discovery Protocol)
- LLDP (Link Layer Discovery Protocol)
- SNMP Forwarding Tables (RFC 1493)
Although SNMP forwarding tables can assist in building topology, maps based solely on them might not be fully accurate—especially when devices do not fully expose their topology or omit VLAN data.
If your generated topology maps do not match your real-world network layout, the most likely cause is that a device is not being monitored. An incomplete topology is usually a sign that NetCrunch lacks visibility into one or more infrastructure devices.
To ensure reliable topology mapping:
- Verify all switches and routers are added to the Atlas
- Confirm SNMP is enabled and accessible
- Use proper SNMP profiles with required credentials
If NetCrunch can’t see it, it can’t map it. Visibility is the prerequisite for topology accuracy.
When NetCrunch detects isolated or unreachable switches, it will display a live warning above the topology map. This alert may indicate that intermediate devices are missing or that SNMP is not properly configured on one or more switches. These warnings help quickly pinpoint where visibility gaps are breaking topology continuity.
Topology maps are also organized by site. A site in NetCrunch represents an isolated network location, typically defined by a unique address space, such as a network behind a NAT. Sites help prevent IP conflicts and allow topology to be visualized per-location. Each site can be monitored by one or multiple monitoring probes, which collect data and relay topology updates to the main server. This organization enables effective monitoring of distributed or multi-location environments without requiring direct routing between them.
Routing Maps (Logical Topology)
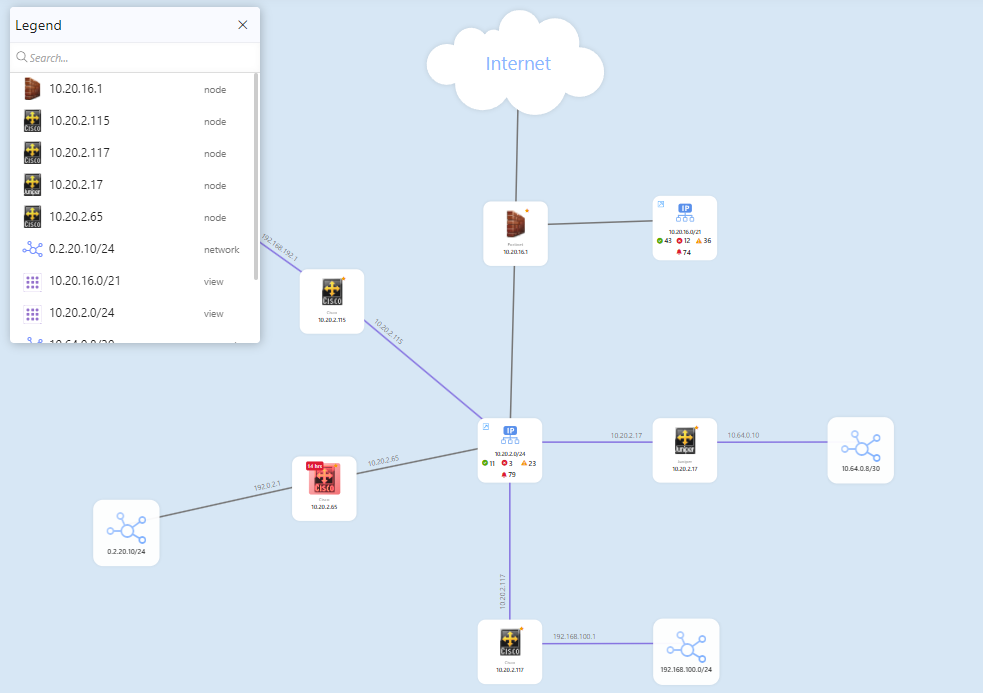
Routing maps in NetCrunch show how routers and subnets are logically connected across your network. These maps provide a high-level view of inter-network communication paths, helping you quickly assess network structure, routing issues, and device reachability.
Automatic Generation
Routing maps are automatically created for each monitored address space. NetCrunch builds them by analyzing IP address assignments, router interfaces, and routing tables obtained via SNMP.
The layout is dynamically generated and updated as topology changes. Unlike static diagrams in many other tools, NetCrunch maps are live, data-driven, and can reflect real-time routing changes.
Interactive Visualization
Each routing map includes the following interactive features:
- Monitored interfaces are color-coded to reflect current status (green for OK, red for down, yellow for warning).
- Interfaces are clickable — clicking an interface displays its real-time traffic and status information.
-
Nodes and networks are draggable — you can reposition any item on the map.
- Once moved, a node becomes pinned — NetCrunch will preserve its position during automatic layout recalculations and adjust the layout around it.
- A legend panel is available in the top-left corner. It allows quick node searching by name or address. Clicking a node in the legend automatically zooms and pans the map to that node's position.
Monitored vs. Unmonitored Networks
In routing maps, monitored subnets are shown using a tile grid icon, while unmonitored networks are marked with a distinct, lightweight network icon.
When you click an unmonitored network: - NetCrunch offers to add the network to monitoring. - Upon confirmation, the subnet is scanned, and discovered devices are added to the Atlas.
This feature makes it easy to incrementally expand monitoring coverage directly from the topology map, ensuring no reachable segment is left unmanaged.
Layout Types
NetCrunch supports multiple layout modes for routing maps:
- Graph Layout – Displays routers and subnets as connected nodes in a flowing graph structure.
- Hybrid Layout – Offers a more compact, space-optimized view by grouping elements.
The layout mode can be changed at any time using the layout selector above the map.
Physical Connection Maps (Layer 2)
NetCrunch visualizes Layer 2 (physical) topology by mapping switch-to-switch and switch-to-node port connections. These maps are derived from SNMP data and from discovery protocols such as CDP, LLDP, STP, and MAC address forwarding tables.
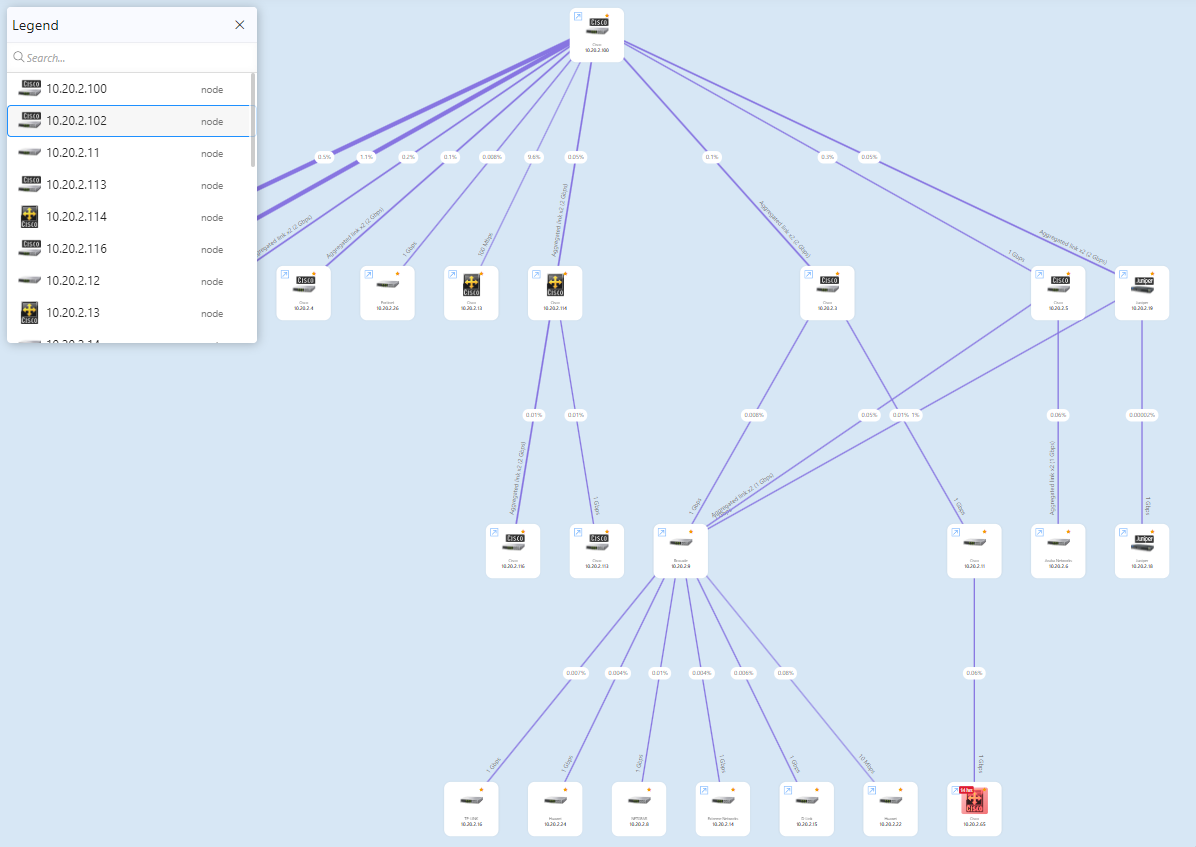
Unlike many other tools, NetCrunch does not overload the top-level map with thousands of end nodes. Instead, it separates the global Layer 2 view from per-switch segments, offering clarity and scalability.
Hierarchical Structure
The top-level map shows only the switches and their interconnections. Endpoints (e.g., computers, printers, IP phones) are not placed directly on this map to maintain readability—especially in large networks with thousands of devices.
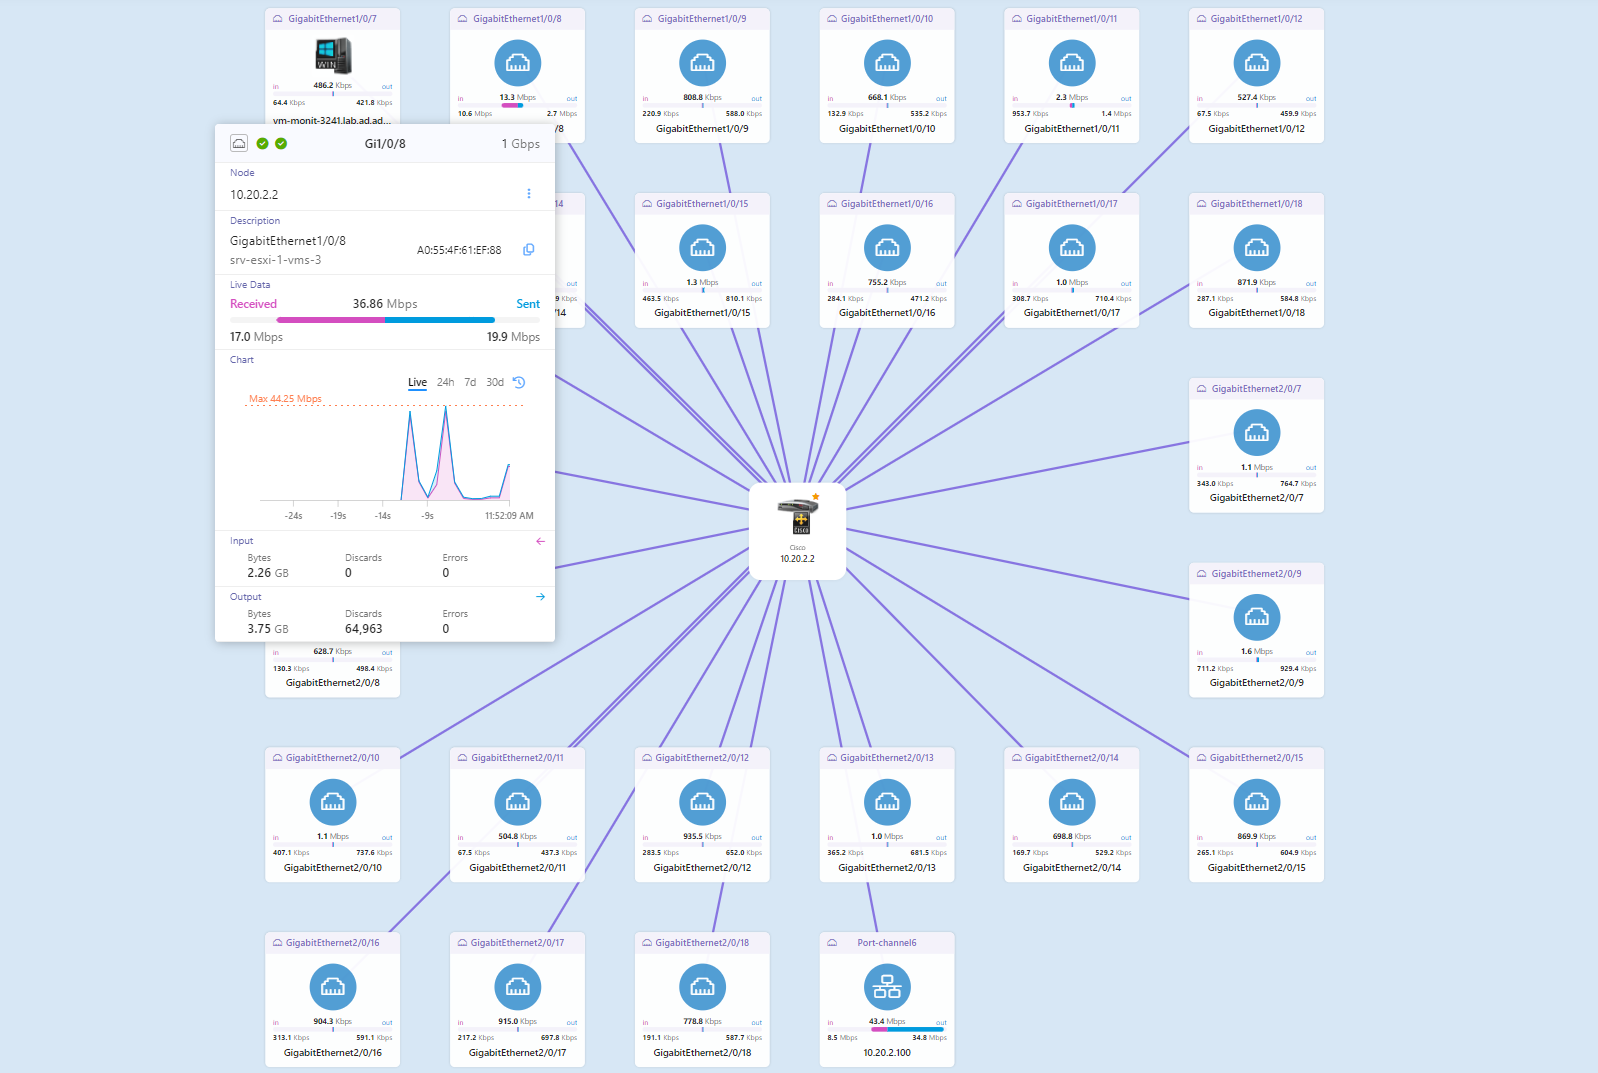
Instead, each switch has its own segment view, listed under the Physical Connections container in the Atlas tree. These views display:
- Connected nodes per port
- Virtual interfaces (e.g., port channels)
- Live interface links for detailed traffic and status
Sometimes, a single port may appear as its own segment. This usually means multiple endpoints are connected through an unmanaged switch (i.e., a switch NetCrunch cannot see via SNMP).
Segment Interaction
In each segment view:
- Switches are visually linked to their ports
- Clicking on a port node opens a live interface popup with real-time traffic, utilization, errors, discards, and historical data (as shown in the popup from the screenshot)
- Clicking the switch-to-segment link (visible on top-level map) opens the same port-level detail panel
These insights allow for quick identification of overloaded ports, dropped packets, or faulty cabling.
Layout & Navigation
Like routing maps, Layer 2 maps are fully interactive:
-
Nodes and ports can be moved manually
- Once moved, they are pinned in place
- The system will auto-layout unpinned elements around the pinned ones
- A legend panel is available to search and locate any node or port; clicking it pans/zooms to the selection
-
Three layout modes are available:
- Tree – ideal for hierarchical topologies
- Star – places the switch at the center
- Graph – organic layout for more complex arrangements
- In Auto mode, NetCrunch chooses the most suitable layout based on segment structure
This separation between global and per-switch views—combined with layered navigation—makes NetCrunch uniquely capable of visualizing large-scale physical infrastructures without clutter or performance degradation.
Configuration and Setup
For physical topology maps to function properly, several configuration steps must be completed to ensure full device visibility and data accuracy.
Enabling Physical Monitoring
Physical connection monitoring must be explicitly enabled in NetCrunch. To activate it:
- Go to Settings → Monitoring → Physical Connections Monitoring
- Enable monitoring and SNMP discovery protocols (CDP, LLDP, STP, and forwarding tables)
- Apply changes and ensure proper SNMP access to all switches
This allows NetCrunch to begin polling devices for port-level data and build the physical connection maps automatically.
Managing SNMP Profiles
Accurate SNMP access is essential for physical topology mapping. You must ensure that SNMP credentials are correctly configured and matched to devices.
To manage SNMP profiles:
- Open Settings → Monitoring → Credentials Manager → SNMP
- Add one or more SNMP v1, v2c, or v3 profiles, depending on your environment
Once a profile is defined:
- If a device is already in the Atlas, NetCrunch will automatically try to match it with the correct profile
- You can also open any individual device’s settings, enable SNMP, and assign a specific SNMP profile manually
There are multiple ways to assign SNMP access, and it’s crucial to verify this step for every switch that should appear on the physical map.
Using the Physical Segments Configuration Wizard
To accelerate and fine-tune the configuration:
- Open the Physical Segments Wizard from the context menu or toolbar
- The wizard scans available SNMP-enabled switches
- It helps you group interfaces, resolve port-channel naming, and organize switch segments into Atlas views
The wizard ensures that each relevant device is properly included and the resulting maps are logically grouped and navigable.
Assigning Switches Manually
If a switch is not automatically placed into a segment, you can:
- Locate the switch node in the Atlas
- Open its context menu and choose "Add to Physical Connections"
- Select or create a segment for manual placement
This manual method is especially useful when SNMP visibility is partial or when devices use non-standard MIBs or discovery protocol implementations.
Troubleshooting Missing Devices or Incomplete Maps
The most common issues with topology accuracy stem from missing or misconfigured SNMP access. To resolve:
- Ensure all switches have correct SNMP credentials and profiles
- Confirm SNMP profiles are properly assigned in the Credentials Manager
- Use NetCrunch node tools to test SNMP communication
- Check that all switches use supported discovery protocols (CDP, LLDP, or STP)
- Validate that switches are actually forwarding MAC address tables
If segments appear with nodes grouped under one port or if entire switches are missing, the cause is typically:
- An unmanaged switch or dumb hub between devices
- A device not monitored or added to NetCrunch
- SNMP forwarding table limitations (incomplete or outdated entries)
You can always re-run discovery, adjust switch assignments, or tune SNMP configuration to restore map completeness and clarity.
Live Interface Status and Traffic
One of the most powerful aspects of NetCrunch’s physical topology maps is their ability to present live interface metrics directly within the map view. This gives administrators immediate visibility into the performance and health of individual ports and connections.
Real-Time Data Per Port
Each switch port displayed on a physical segment can be clicked to reveal a live interface popup. This panel shows:
- Port name and alias
- MAC address
- Link speed and current usage (inbound/outbound)
-
Status indicators for:
- Operational state
- Administrative state
- Interface errors, discards, and traffic statistics
-
Interactive traffic chart, which displays:
- Current and historical traffic data (live, 24h, 7d, 30d)
- Input/output volume over time
- Discards and errors at-a-glance
This allows you to identify bottlenecks, faulty cables, misconfigured VLANs, or flapping ports directly from the topology view—without switching to other tools or interfaces.
Switch-to-Segment Links
On the global physical topology map, each switch is linked to its physical segment. Clicking on this link opens the live interface popup for the corresponding port or port channel.
This feature provides a direct path from the high-level overview to low-level diagnostics, enabling efficient root-cause analysis of network issues.
Performance Metrics Available
When SNMP is correctly configured and monitored, NetCrunch collects and displays the following per-interface data:
- Traffic (in/out Mbps)
- Packet discards
- Error counts
- Total bytes transferred
- Interface uptime
These metrics are updated in real time and can be trended over time for capacity planning and anomaly detection.
With this level of per-port granularity, NetCrunch transforms passive diagrams into active diagnostic dashboards.
Navigating and Managing Topology Views
NetCrunch’s topology maps—both routing and physical—are designed to be more than static diagrams. They are live, interactive, and navigable interfaces that help users work efficiently in large-scale environments.
Atlas Tree Integration
Each topology view is accessible directly from the Network Atlas tree, which organizes all views hierarchically. Topology views are grouped under:
- IP Networks (for routing maps)
- Physical Connections (for Layer 2 maps)
You can expand these containers to browse all generated or user-added maps, including segments and special views. Selecting an item in the tree opens its live map view in the right pane.
Map Navigation Tools
Every topology map includes built-in tools to help users navigate large or complex networks:
- Pan and Zoom – Use mouse drag and scroll to pan and zoom the canvas freely
- Auto-Center – Use the auto-center control to refocus the view on the core of the map
-
Legend Panel – A small pop-up at the top-left allows:
- Search by node or address
- Quick navigation – Clicking an entry automatically zooms and pans to that object
- Layout Selector – Choose between Graph, Tree, Star, or Auto layout modes (depending on map type)
The layout engine ensures visual clarity and responsiveness even with hundreds of objects.
Manual Editing and Pinning
Topology maps support full manual layout control:
- Move any object by dragging it on the map
- Moved objects are pinned — they will retain their positions during future layout recalculations
- The system automatically arranges unpinned objects around pinned ones for optimal readability
This hybrid of automatic and manual layout makes it easy to tune visual structure while preserving clarity.
Linking and Navigation Between Maps
Devices often appear in multiple maps (e.g., a switch in physical segments and in routing maps). NetCrunch allows:
- Contextual jumping between views – For example, right-clicking a device may offer shortcuts to its related physical or routing map
- Consistent layout rules across views – So users quickly recognize objects and relationships
Topology views can also be linked to dashboards, node detail views, or embedded in Graphical Views for advanced use cases.
By combining live data, flexible layout, and intelligent navigation, NetCrunch makes its topology maps practical tools for daily operation—not just documentation artifacts.
Best Practices and Use Cases
NetCrunch topology maps are not just visual aids—they are functional tools used daily for troubleshooting, planning, and operational awareness. Below are key practices and real-world scenarios where topology mapping delivers significant value.
Use Topology to Verify Connectivity and Detect Gaps
- Ensure full visibility by confirming that all infrastructure devices are mapped and monitored
- Use routing maps to identify routing gaps, such as disconnected networks or missing routers
- Use physical maps to find unseen segments, like unmanaged switches or incorrect port setups
Unmapped nodes or ports often indicate misconfiguration or limited SNMP access—critical issues that can be resolved before they affect operations.
Detect Misconfigured or Faulty Devices
- Quickly spot down interfaces or isolated switches via real-time indicators
- Monitor interface errors and discards at-a-glance across the map
- Identify endpoints connected to the same port (often a sign of unmanaged intermediary hardware)
Topology maps help uncover devices that are improperly added, assigned the wrong VLANs, or physically miswired.
Troubleshoot Site-to-Site or Subnet Routing Issues
- Use routing maps to trace path relationships between subnets
- Detect broken links or unreachable networks caused by router failures or incorrect static routes
- Pinpoint which site or device is failing when multiple monitoring probes are deployed
This is particularly useful in multi-site or NATed environments, where routing visibility is otherwise fragmented.
Track Redundant and Critical Paths
- Visualize redundant switch uplinks, link aggregation groups, and spanning tree behavior
- Confirm HA configurations and validate that backup links are active and monitored
- Assess single points of failure directly from the map structure
By seeing which ports and links carry critical traffic, teams can better prioritize upgrades or repairs.
Align Maps With Change Management
- Use before-and-after snapshots to validate changes during switch replacements or topology redesigns
- Observe automatic remapping as devices are added or removed
- Reduce downtime risk by understanding how changes will impact dependent nodes
In dynamic environments, topology maps reduce human error and accelerate safe rollouts.
Whether you're operating a small LAN or a multi-site distributed infrastructure, NetCrunch topology maps give you a live, graphical interface to manage, diagnose, and improve your network.
Related Features
Topology maps in NetCrunch are tightly integrated with several other key platform features. Together, they create a comprehensive environment for monitoring, visualization, and diagnostics.
Interface Monitoring
All topology views reflect live status and performance of network interfaces, powered by SNMP polling:
- Interface utilization (in/out)
- Error and discard counters
- Link state (up/down/admin status)
- Historical trends
This interface-level visibility enables real-time health monitoring directly from topology diagrams.
Monitoring Dependencies
Topology maps help visualize dependencies between nodes, such as:
- Switch-to-endpoint relationships (Layer 2)
- Router-to-subnet links (Layer 3)
NetCrunch uses this structure to automatically determine root causes of alerts. For example, if a switch goes down, alerts from connected endpoints are suppressed or deprioritized, avoiding alert storms.
SNMP Configuration Tools
The SNMP Credentials Manager allows defining and managing all SNMP v1/v2c/v3 profiles:
- Centralized access via Settings → Monitoring → Credentials Manager
- Automatic profile matching for newly added devices
- Manual SNMP configuration per-node, with testing tools included
Proper SNMP setup is critical for accurate topology and interface data collection.
By combining real-time interface data, smart alert correlation, flexible SNMP management, and customizable visuals, NetCrunch topology maps act as both operational tools and communication assets for IT teams.