
What Is a Node in NetCrunch?
This topic explains the definition of a Node in NetCrunch. It clarifies why a Node is treated as a service endpoint rather than a physical device, and how this distinction improves monitoring accuracy for modern infrastructure.
Core Concept
In NetCrunch, a Node is a Service Endpoint, not necessarily a physical device.
While a Node often corresponds to a physical device (such as a switch or server), NetCrunch defines it as a logical root entity to which monitoring data is attached. This distinction allows you to monitor what is running and reachable, rather than just the hardware box itself.
Why This Distinction Matters
Traditional monitoring tools often use a "Device-Centric" model, where each piece of hardware corresponds to a single entry in the monitoring tree. This approach struggles with modern infrastructure:
- Virtualization: One physical server may host dozens of critical, distinct virtual machines.
- Cloud & SaaS: A service like "Office 365" has no physical device you can manage, but it is a critical endpoint.
- Shared IPs: A reverse proxy or load balancer may serve multiple distinct applications on a single IP address.
By treating the Node as an Endpoint, NetCrunch allows you to model these scenarios accurately without being tied to physical hardware constraints.
Types of Nodes
NetCrunch supports several node types to cover various monitoring scenarios:
1. IP Node (Network Endpoint)
The most common type. It represents a network-reachable entity, usually identified by a DNS name or IP address.
- Use case: Servers, routers, switches, printers.
- Key characteristic: It can host multiple network services (HTTP, SSH, SQL), which are monitored as sensors attached to this node.
2. Cloud Service Node
Represents an external API or SaaS platform.
- Use case: AWS CloudWatch metrics, Azure monitoring, Office 365 status.
- Key characteristic: Models service availability and performance, abstracting away the provider's infrastructure.
3. Telemetry Node
A data ingestion point for push-based metrics.
- Use case: Receiving data from scripts, IoT devices, or applications that push JSON/XML data to NetCrunch.
- Key characteristic: Often has no network address to ping; it simply exists to receive and visualize data.
4. Virtual & Composite Nodes
Logical nodes are used to group dependencies or calculate business status.
- Use case: A "Corporate Email" node that aggregates status from the SMTP server, the DNS server, and the Cloud Gateway.
- Key characteristic: Exists purely as a status root for business logic.
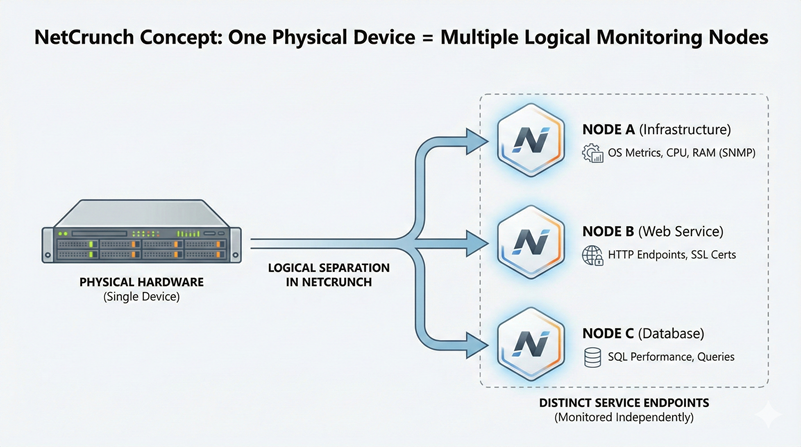
Practical Example: One Server, Multiple Nodes
To understand the power of the Endpoint model, consider a single physical Linux server running both a database and a web server for two different departments.
In NetCrunch, you can model this as:
- Node A (Infrastructure): Monitors the Linux OS, CPU, RAM, and disk space.
- Node B (Web Service): Monitors the HTTP endpoints and SSL certificates.
- Node C (Database): Monitors the SQL performance metrics.
Even though they share the same hardware, they can have different:
- Alerting rules (SQL team vs. Web team)
- Dependencies
- Reporting schedules
Summary: The NetCrunch Mental Model
When adding a Node to NetCrunch, do not ask: "What physical hardware is this?"
Instead, ask:
- What acts as the endpoint? (IP, URL, API, or Logical Group)
- What data belongs to this endpoint?
This shift allows you to build a monitoring strategy that mirrors your services, not just your inventory list.